EVM is a well-known concept which seems easy to implement simply because it has only three primary variables. However, in a live project, due to complexity of the data, component and variables, most people fail to implement it correctly. EVM often gets criticised or negatively commented upon that it does not add any value.
Some of the criticism is misdirected or has no merit. For example, we often hear that it does not evaluate the critical path and/or it does not show the logic, etc. The EVM is part of the Integrated Planning system and should be reviewed with other components of the system.
In this article, we will look at the EVM estimating formulas and a technique to improve the analysis.
The EVM simple Estimating formulas are as follows:
Cost Estimate at Completion
EAC = Budget At Completion / CPI
Duration Estimate at Completion
EAC (t)= Planned Duration / SPI(t)
The Challenge: Performance Fluctuations
During the execution as the CPI and SPI get calculated and the charts get developed. The charts below, are examples of the SPI and CPI.
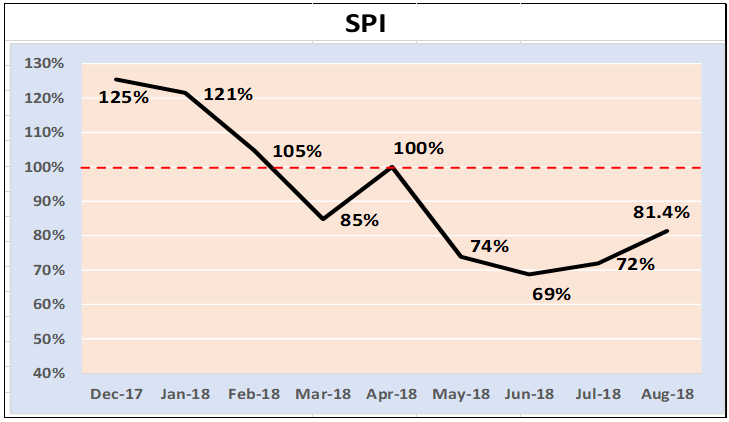
Schedule Performance Index (SPI) Trends
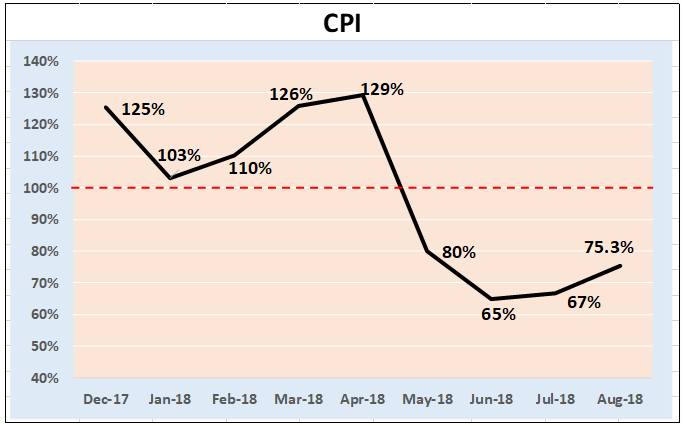
Cost Performance Index (CPI) Trends
The charts are showing the trends and fluctuations and as a result, the estimates get changed and fluctuate after every update. Now, imagine, the estimated numbers get reported to management which says, the CPI is 129% so, the project would finish under budget, week after, the report says, the CPI is 80%, therefore, project would be over budget and additional budget would be required. This type of reporting will not be readily acceptable to management and after a while they would ignore it.
So, how could this situation be resolved? In order to improve the reporting and avoid the fluctuation as much as possible, we put the performance indicators in the simulation. The result of the simulation is a probabilistic estimate (finish date or Cost), similar to chart below:
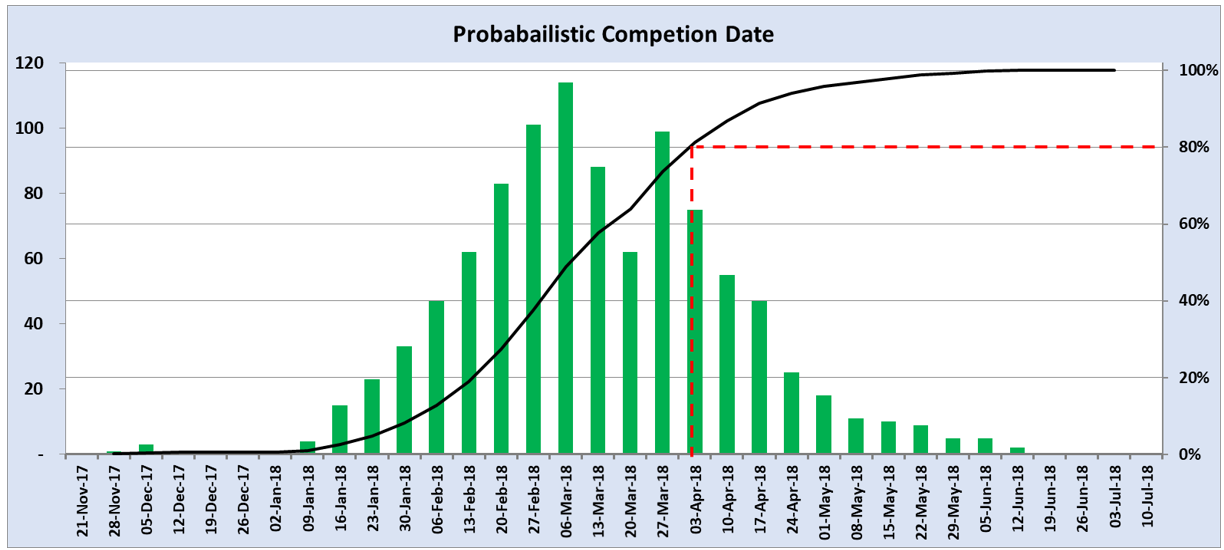
Through this analysis, the project control team focuses on the trend, range, Lower limit and upper limit, etc. also, until there is no drastic change in the performances then probabilistic date/cost will most-likely stay in an acceptable range..
Discussion
Thanks very much for your sharing.
Thanks Diab for the comment
Appreciated. Thank you
Thanks Nani for the comment
This is really interesting, You're a very skilled
blogger. I have joined your rss feed and look forward to
seeking more of your magnificent post. Also, I have shared your site in my social networks!
http://sonicsquirrel.net/detail/user/celitime1978/
Preserve 5% now together with your lower price
essay writer website
essay writer website https://www.lilaloa.com/2019/12/how-to-make-decorated-reindeer-cookies.html
Leave a Comment