Schedule resource loading is notoriously challenging. On the contrary, cost loading a schedule as per the cost report (BOQ cost) is often considered one of the easiest tasks. The process seems simple: locate the activities related to each cost item, then assign the cost value.
The $90 Million Mistake
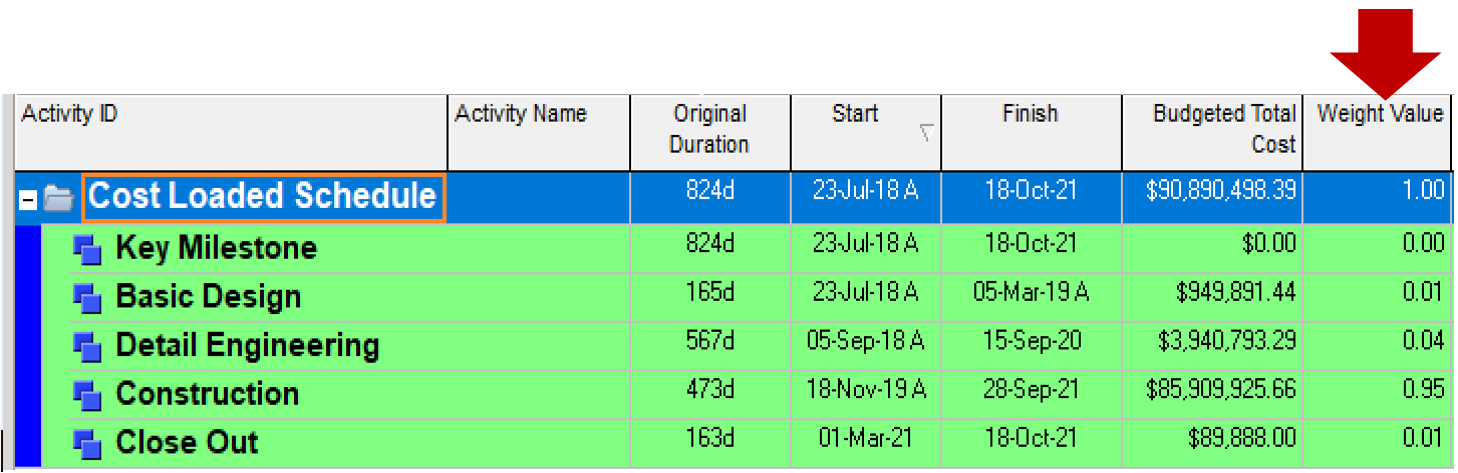
In a recent $90 million project, the planner assigned costs directly to the activities. The resulting distribution showed Construction at a massive 95% weight, and Detail Engineering at a mere 3.5%.
The Contractual Reality Check
When the contract and cost reports were properly reviewed, two critical errors emerged:
-
1. Commingled Costs
The Engineering cost for many activities was incorrectly combined with Construction costs.
-
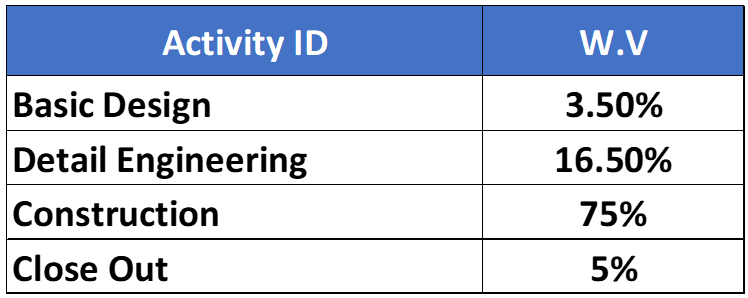
2. Ignored Contractual Weights
Mandatory contractual weight values were completely bypassed when developing the overall S-Curve and progress report.The contractual weight values were like the following table:
The Tale of Two S-Curves
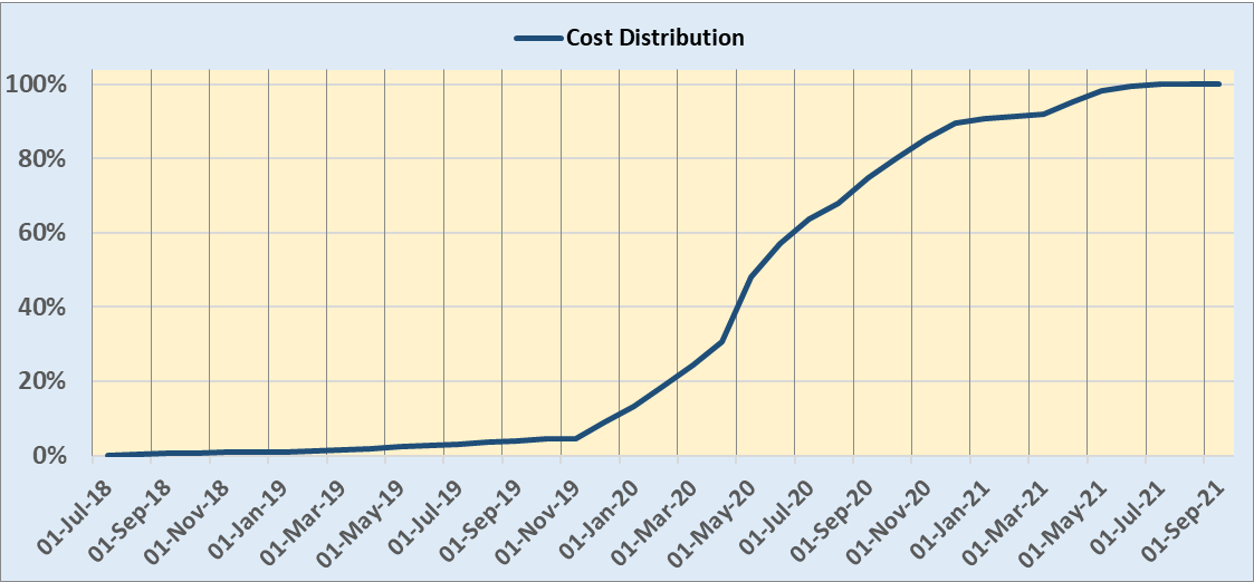
The Flawed S-Curve (Direct P6 Extraction)
Due to No.1 above, the cost loading could not be acceptable which as a result directly affected the weight values, overall S-Curve and Progress! After completion of the Cost loading, five S-Curves were developed: Basic Design, Detail Design, Construction, Close Out and Overall. To develop the Overall S-Curve, the data was extracted directly from P6 and contractual weight values were ignored. The developed S-Curve as follows:
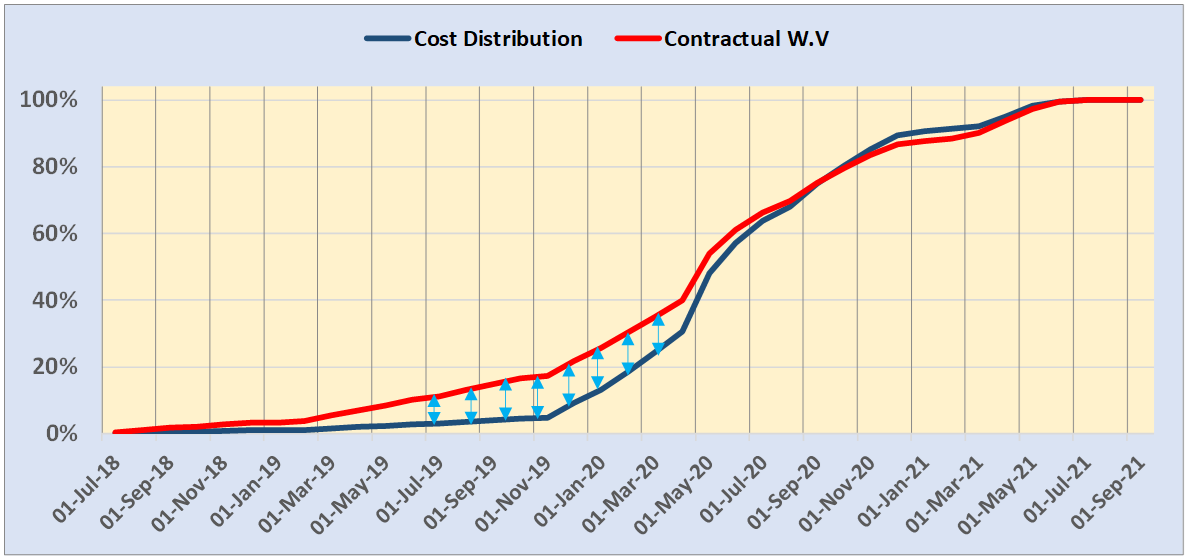
The Corrected S-Curve (With Contractual Weights)
Once the required contractual weight values were applied, the chart shifted dramatically, revealing a terrifying reality: a gap of more than 12% in some periods.
The Delusion of Progress
In December 2019, if the actual progress was 10%, the team looking at the flawed first chart assumed they were 5% ahead of schedule.
In reality, based on the correct weighted chart, they were 10% behind.
Would a project operating under this delusion finish on time or within budget? Unlikely. As per recent reports, that specific project is now 9 months behind schedule, largely due to a misleading planning and reporting system.
Discussion
D
??
Leave a Comment