Have you ever faced a situation where a Project Manager requested you to calculate the required number of Resources for a specific discipline, but there was no detailed Schedule or the Schedule was not resource loaded? On occasions of this nature, linear calculations are often used, assuming a fixed number of resources and a consistent production rate throughout the Project. On the contrary, that approach is far from reality due to several factors:
Why Linear Math Fails
So, what is the solution?
It’s important to note that most Scheduling Software Packages either cannot incorporate these factors or require extensive calculations and manual data entry! Under circumstances of this nature, we utilise our Khono Analysis Toolkit (KAT). Let’s take a piping Project as an example to demonstrate the KAT process.
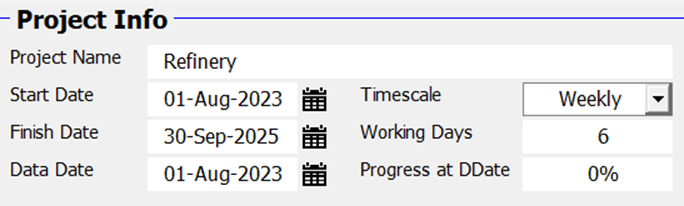
Step 1: Project Initiation
Define the project scope and core metrics within the KAT environment.
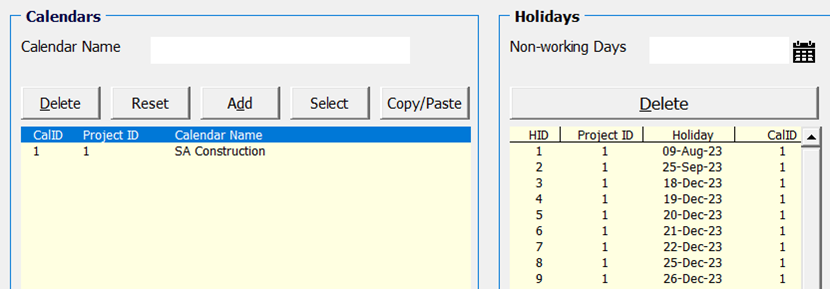
Step 2: Holiday Integration
Assign specific construction holidays to generate an accurate workable calendar.
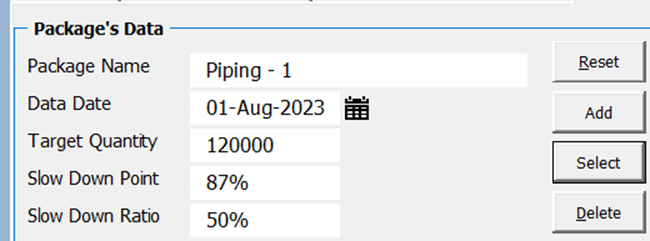
Step 3: Create Scenarios
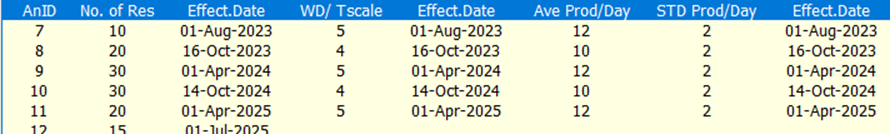
Created three scenarios based on the following Piping information
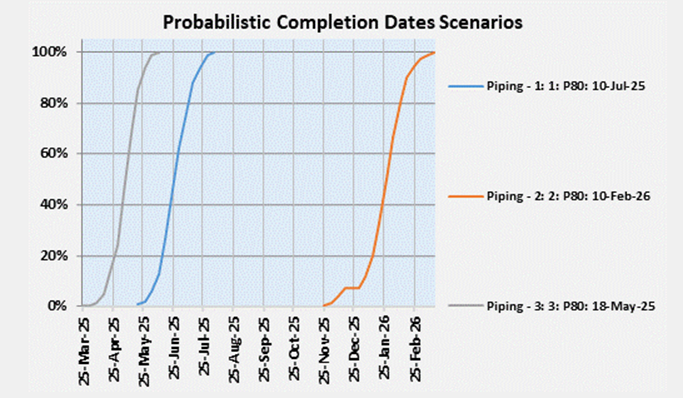
Scenario Comparative Analysis
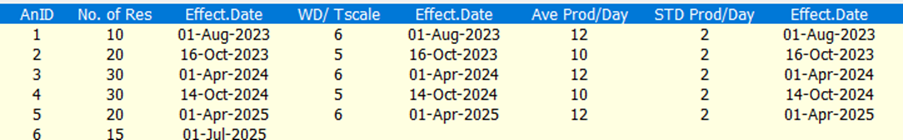
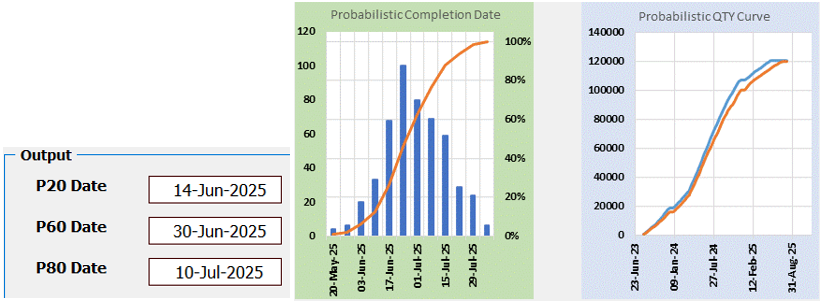
Scenario 1: Standard Mobilization
Analysis of 10 initial welders, working 6 days per week and 12ID for production rate/day, then mobilizing 20 welders, working 5 days per week and 10ID as production rate. The details as follows:
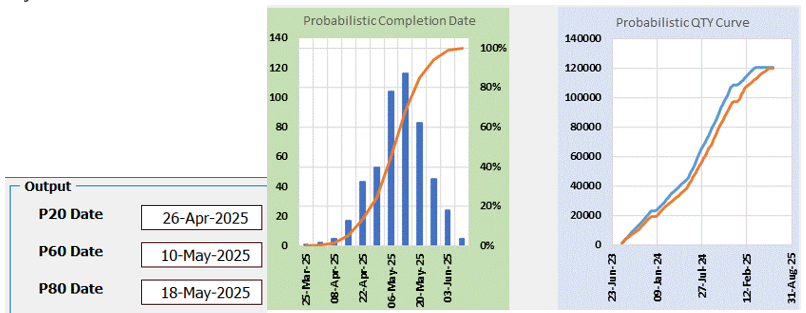
After running the KAT analysis, we obtain results in the form of charts:
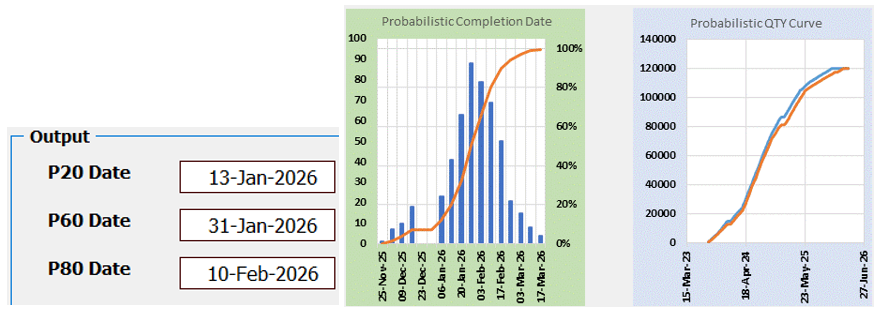
Scenario 2: Reduced Work Weeks
Adjustment to 5 and 4-day work weeks based on site-specific constraints.
The outcome of the analysis for the second scenario is as follows:
Scenario 3: Skilled Resource Optimization
Leveraging highly skilled welders at a 14ID/day production rate.
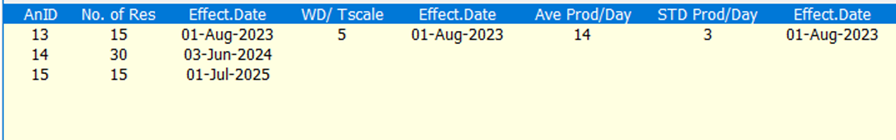
The outcome of the analysis The analysis result is as follows:
Strategic Outcomes
After discussing the outcomes and generating additional scenarios, it was decide to proceed with the third scenario. We can then estimate the cost of piping based on this scenario..
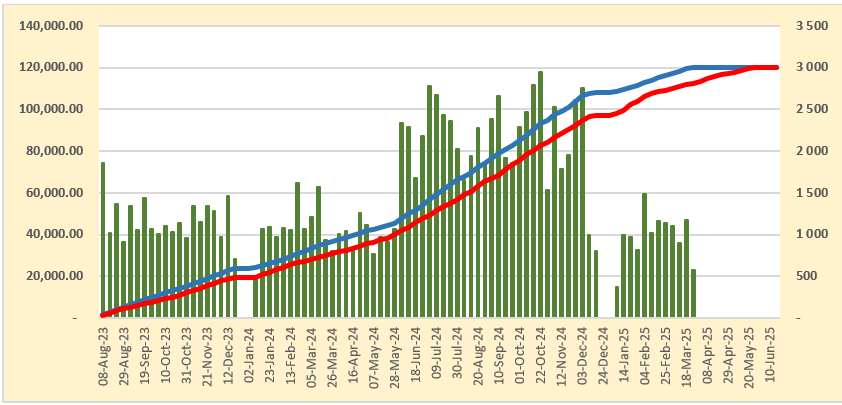
KAT also facilitates advanced Excel exports for customized project dashboarding:
Discussion
No comments yet. Be the first to share an insight.
Leave a Comment