The forecast completion date is one of the most common requests from Project Managers and clients to the Project Controls team. Accurate forecasting is critical, particularly for estimating time-related project costs. Various techniques and approaches can be used to determine this forecast. In this article, we review some of these methods and introduce a new application currently under development.
1. The Traditional Schedule
The most common source, but only reliable when the project is on track. It fails to account for the Schedule Reliability Factor. If a 30-day project slips by 5 days due to poor productivity, the schedule assumes future work will return to 100% efficiency, ignoring the performance trend.
To illustrate the concept of schedule reliability, consider the following example. Assume a project consists of three sequential activities, each with a duration of 10 days and linked by Finish-to-Start (FS) relationships. Based on this logic, the total planned project duration is 30 days.
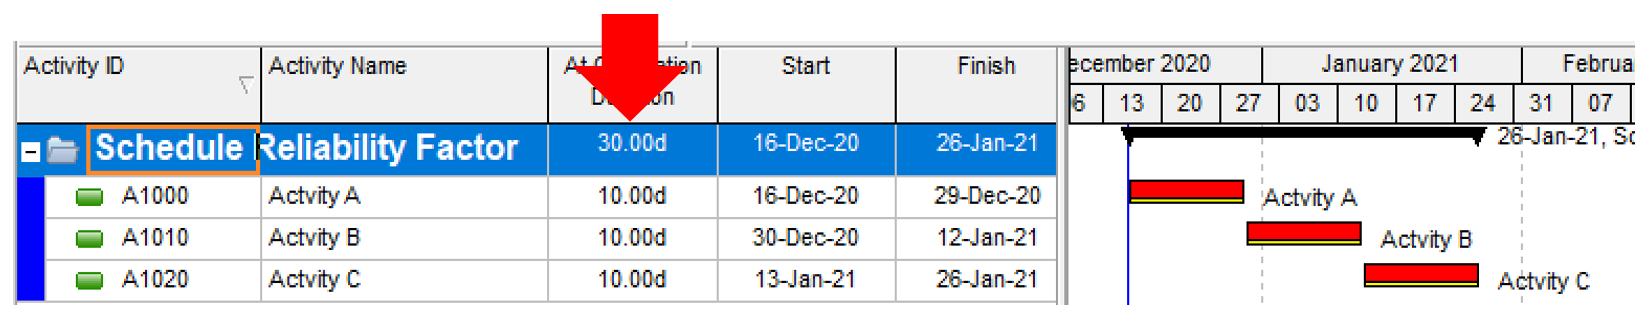
After the first 10 days, Activity A is not completed and requires an additional 5 days. Consequently, the project completion date shifts by 5 days, increasing the total duration from 30 to 35 days. From a purely logical and scheduling perspective, the 35-day forecast appears correct. However, an important question arises: how reliable or achievable is this revised completion date?
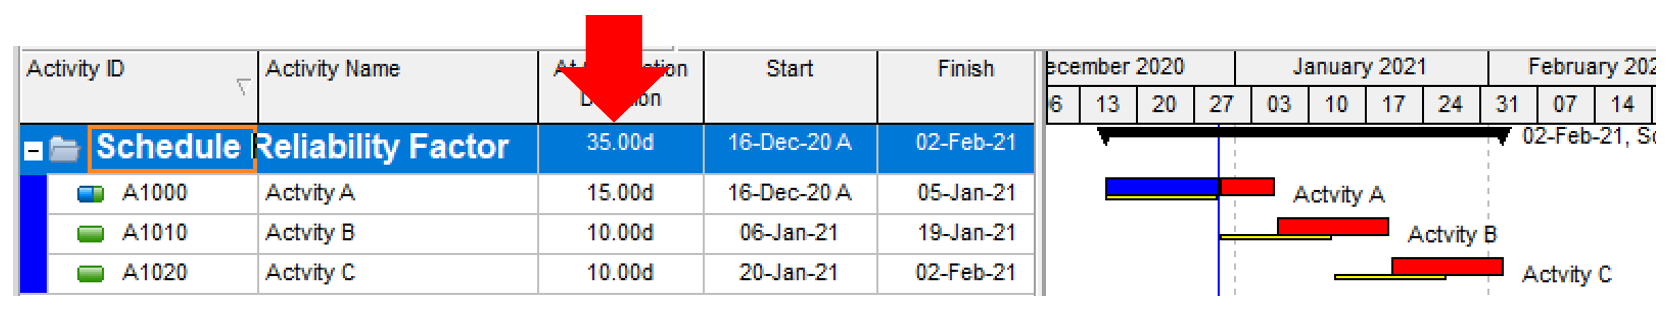
If the delay in Activity A is caused by reduced productivity or performance, it is reasonable to expect that the same conditions may affect the subsequent activities. Under such circumstances, Activities B and C may also experience similar productivity levels and require approximately 15 days each instead of the planned 10 days.
In that case, the total project delay would not be limited to 5 days. Instead, the project could finish 15 days later than originally planned. This demonstrates that when delays are driven by productivity issues, the project completion date becomes closely tied to the actual productivity rate. Therefore, the forecasted schedule cannot be considered reliable unless productivity improves; otherwise, the reliability of the schedule will simply reflect the ongoing performance level.
2. Schedule Risk Analysis
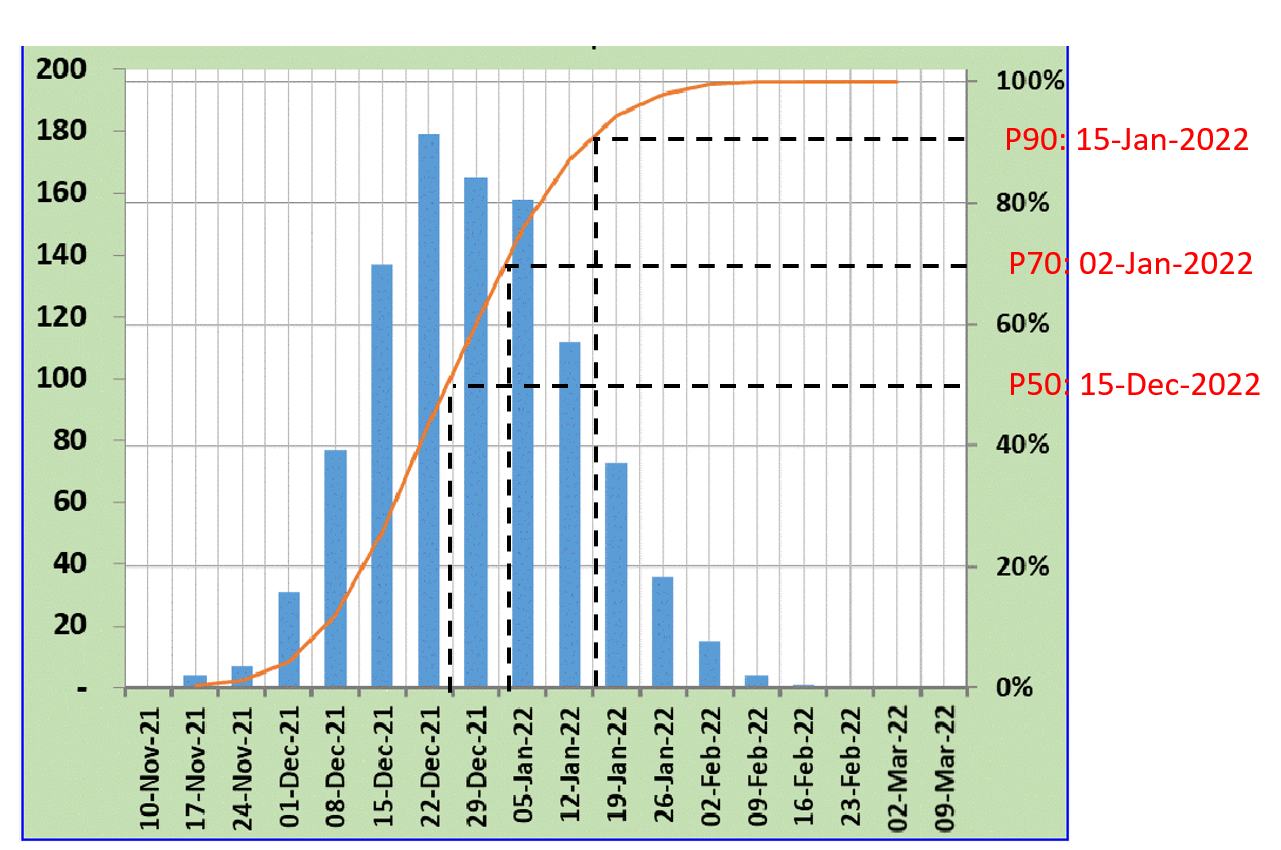
This method is a more advanced forecasting technique than traditional scheduling and is therefore widely used by many mature organizations to produce more reliable forecasts of project completion dates and costs. It generates probabilistic outcomes by incorporating quantified risks that are assigned to individual project activities.
As a result, the forecast completion dates and costs are expressed in probabilistic terms rather than as a single deterministic value. In many cases, this approach produces more realistic projections than those derived from the baseline schedule alone.
However, despite the improvement in forecasting accuracy, some critics argue that the technique does not always deliver the level of value expected. These concerns arise from several factors, although the discussion of those reasons falls outside the scope of this article.
SRA Probability Distribution
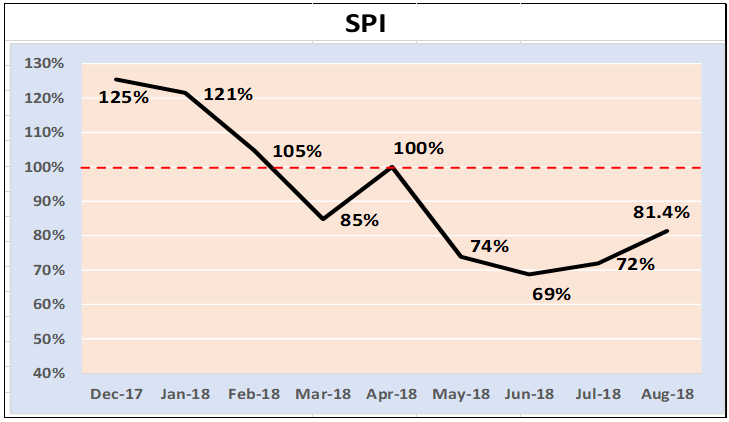
SPI Performance Chart
3. Performance Based Forecast
When performance indices from Earned Value Management (EVM) become available, they can be used to forecast project completion dates. Forecasts derived from these indices are generally more reliable than those obtained directly from the schedule.
However, these calculations typically produce only a single forecast value after each reporting update. In addition, performance indices tend to fluctuate over time as project conditions change. As a result, the forecast dates may also vary from one reporting period to another, which can lead project teams to question their reliability and, in some cases, disregard them altogether.
However, despite the improvement in forecasting accuracy, some critics argue that the technique does not always deliver the level of value expected. These concerns arise from several factors, although the discussion of those reasons falls outside the scope of this article.
4. KAT Analysis and Calculation
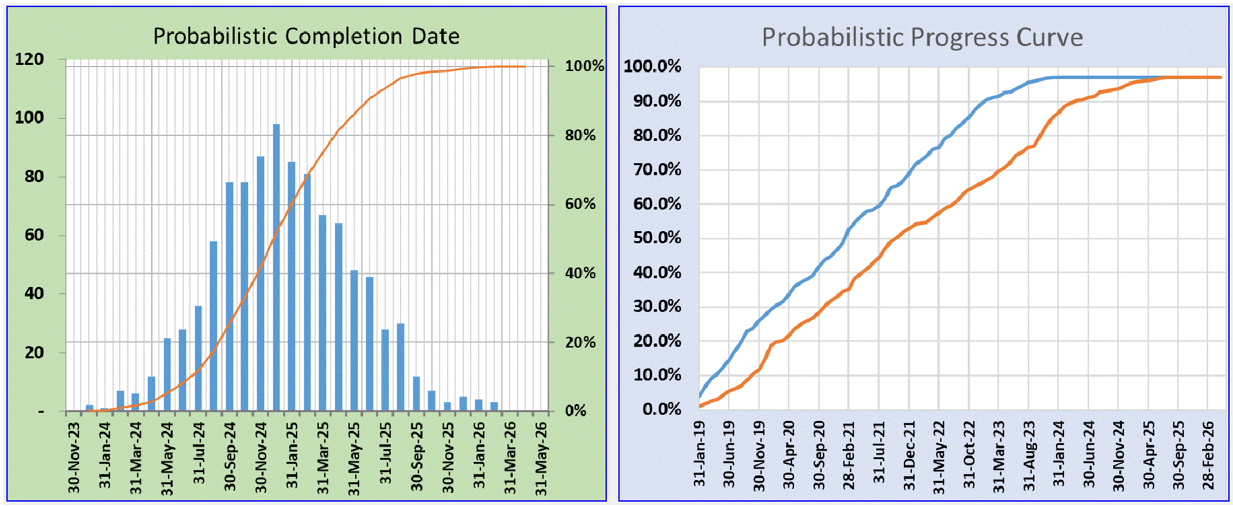
This technique produces probabilistic completion dates as well as probabilistic progress curves. It enables users to run multiple scenarios and display the results together in a single chart.
By comparing these scenarios visually, the project team can gain a clearer understanding of the potential forecast dates, evaluate different assumptions, and identify the most appropriate course of action.
The outputs therefore support more informed decision-making by providing a range of possible outcomes rather than a single deterministic forecast. The following screenshots illustrate examples from the current development version.
KAT Analysis Output
Discussion
No comments yet. Be the first to share an insight.
Leave a Comment