How much time buffer should you actually add to a project duration? Standard percentages often fail because they ignore the most critical factor: Performance.
Common Approaches
- • 1-2 months per year of duration.
- • Fixed 10% or 15% of duration.
- • Risk Analysis output (The Mature approach).
Why it's Challenging
Calculation of time buffers is often hindered by a lack of standard procedures, project politics, and a failure to understand the project's unique environmental characteristics or "known-unknown" risks.
Time contingency is super critical for Clients who generally fund the projects through banks or other financial institutions. In a less mature organization, they do not consider it and assume that the contractor should deliver it as per the contract. Some organization use a standard percentage (10%, 15%) of the project execution duration. And more mature ones, try to use risk analysis as best as possible.
As per our experience, one of the most important factors that have to be considered is the project performance. Calculation based on the performance could be very simple but surprisingly much more accurate. The main challenge of this approach, though, is being over optimistic especially at the early days of the project which would not be easy to take a lower rate. However, the project team, specifically Project Controls, should develop scenarios and present what the potential output could be as per each performance level.
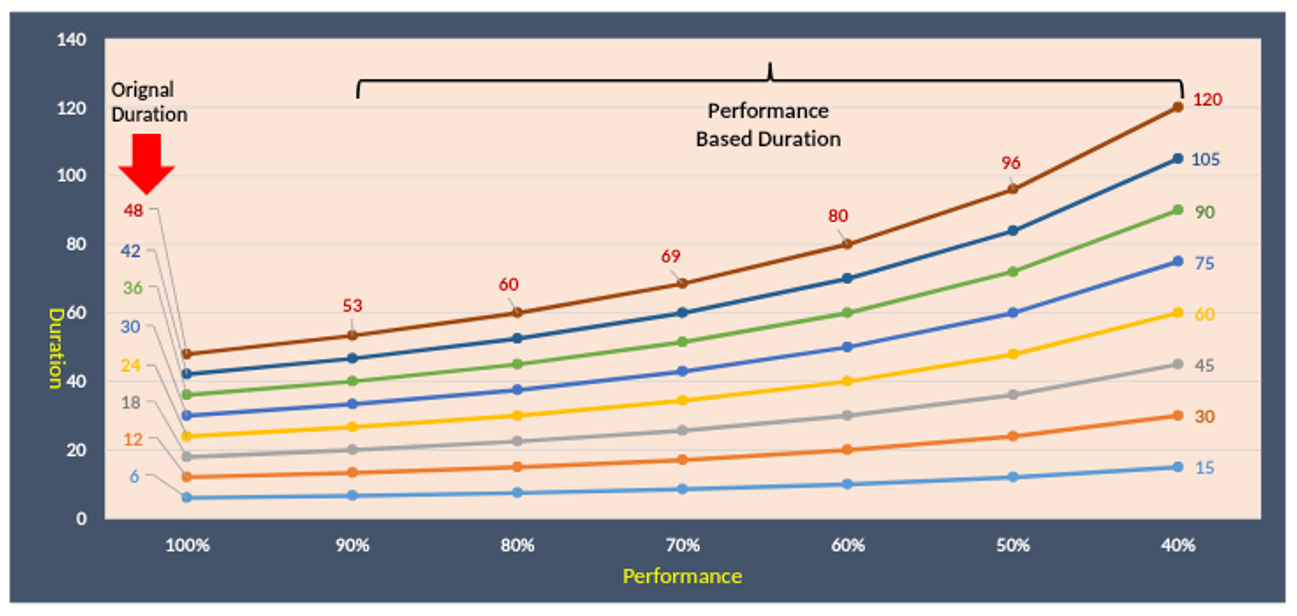
Performance Based Forecasting
For a project with an original duration of 12 months, execution at 80% performance extends it to 18 months. At 40% performance, that same project balloons to 30 months.. Next chart shows the completion date scenarios based on performances.
Performance at the early stages is often over-optimistic; Project Controls must develop scenarios for every performance level.
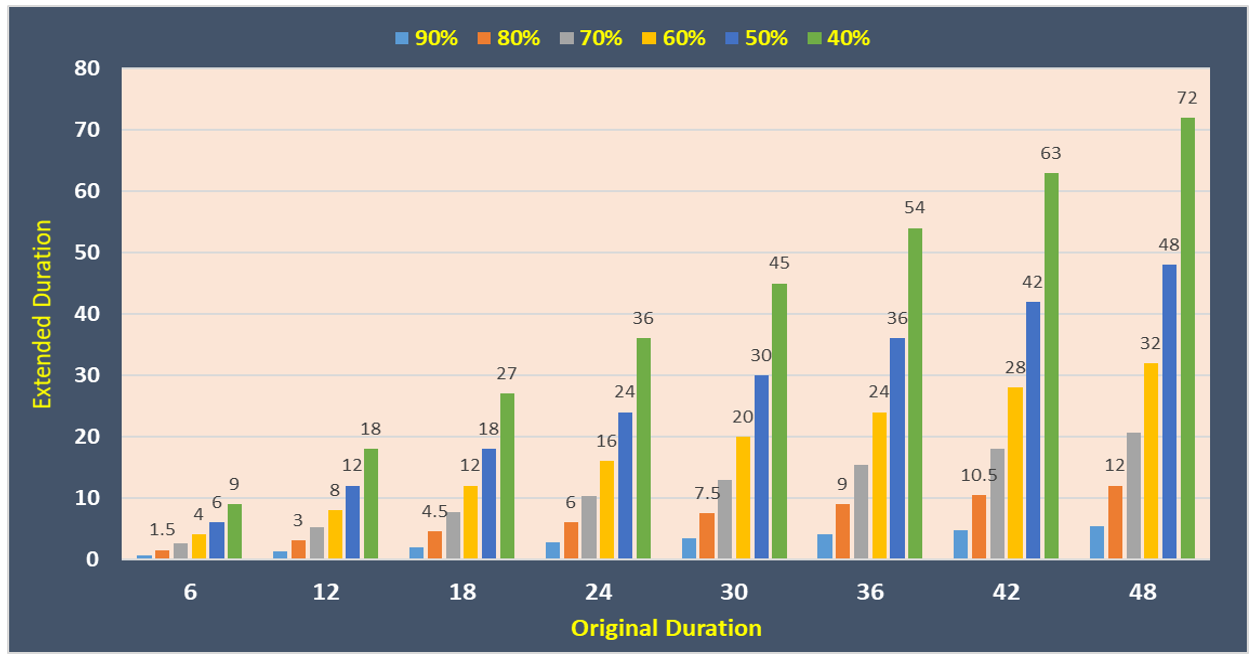
Completion Duration for A 48-Month Project
For a project with the Original Duration of 48 months, it could take 60 months with 80% performance, 96 months with 50% performance and 120 months and with 40% performance! The following chart illustrates the extended duration based on the performance
Case Studies: Power Station Projects
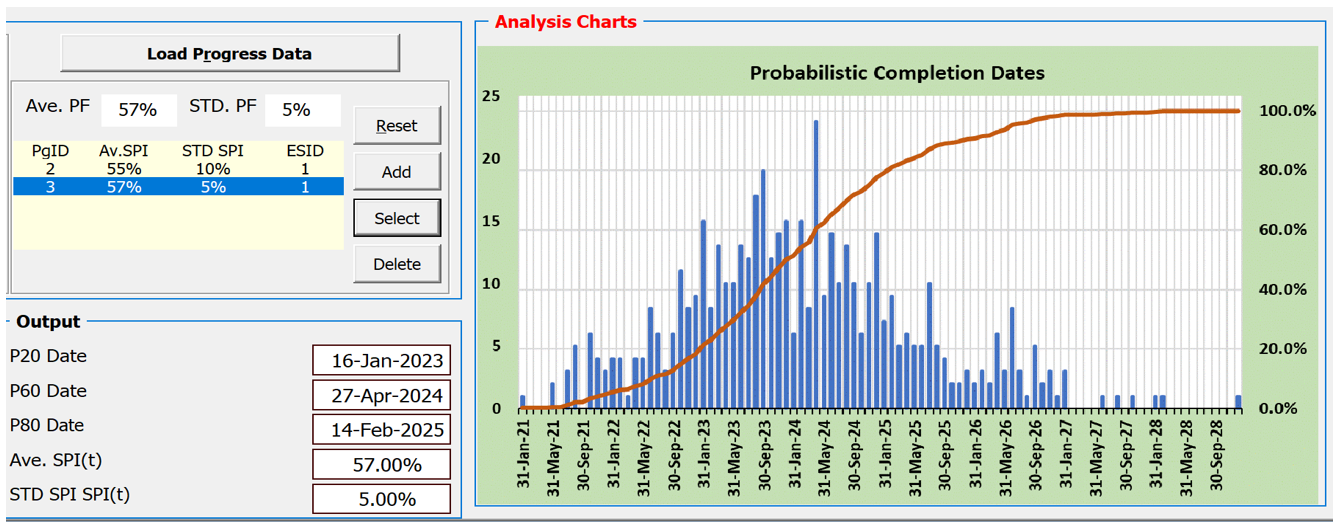
Kusile Power Station
The construction started in August 2008 and commercial operation of the 1st unit was planned for June 2013 (about 59 months). The commercial operation of the 1st unit was achieved in March-2017 (about 104 months). It means that the performance of the overall project was 57%.
Based on linear performance, the final unit operation forecasts for January 2025.
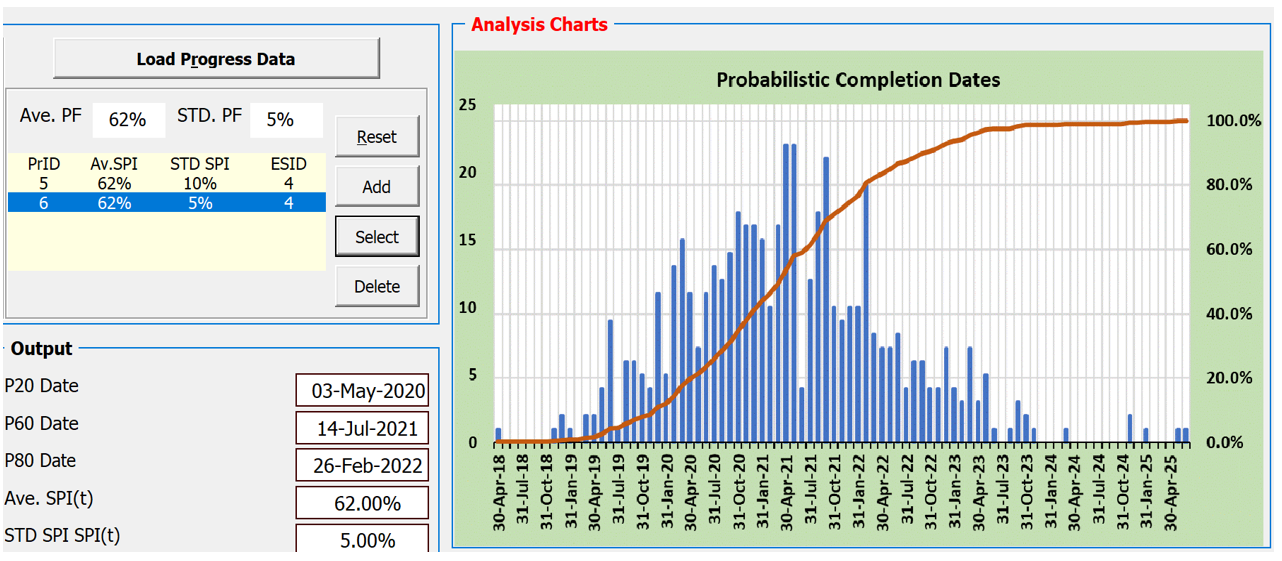
Medupi Power Station
The construction commenced in May 2007 and planned date for 1st unit (unit 6) commercial operation was Jun 2012 and last unit was planned for December 2015. The actual date of the 1st commercial operation was on August 2015. It means that the performance of the overall project was 62%.
Forecasted completion for the last unit based on performance was March 2021.
Probabilistic Forecasting with KAT
The above calculations are linear and considers that the performance stays at the same rate. Obviously, the performance does fluctuate therefore, to improve the forecast date, KAT Earned Schedule Analysis function could be used. KAT provides, three probabilistic dates for the last units commercial operations.
To forecast the next powerstation project duration and time contingency, what performance factor should be used? May be between 60% and 70%!
What could be the relationship between time contingency and cost contingency? Obviously the cost estimate could not be accurate without forecasting the project duration including the time contingency!
Discussion
No comments yet. Be the first to share an insight.
Leave a Comment