The figure illustrates two S-curves for a project:
- The red curve and blue bars are derived from the distribution of the Engineering, Procurement, and Construction (EPC) budget.
- The black curve and orange bars are generated from the detailed project schedule.
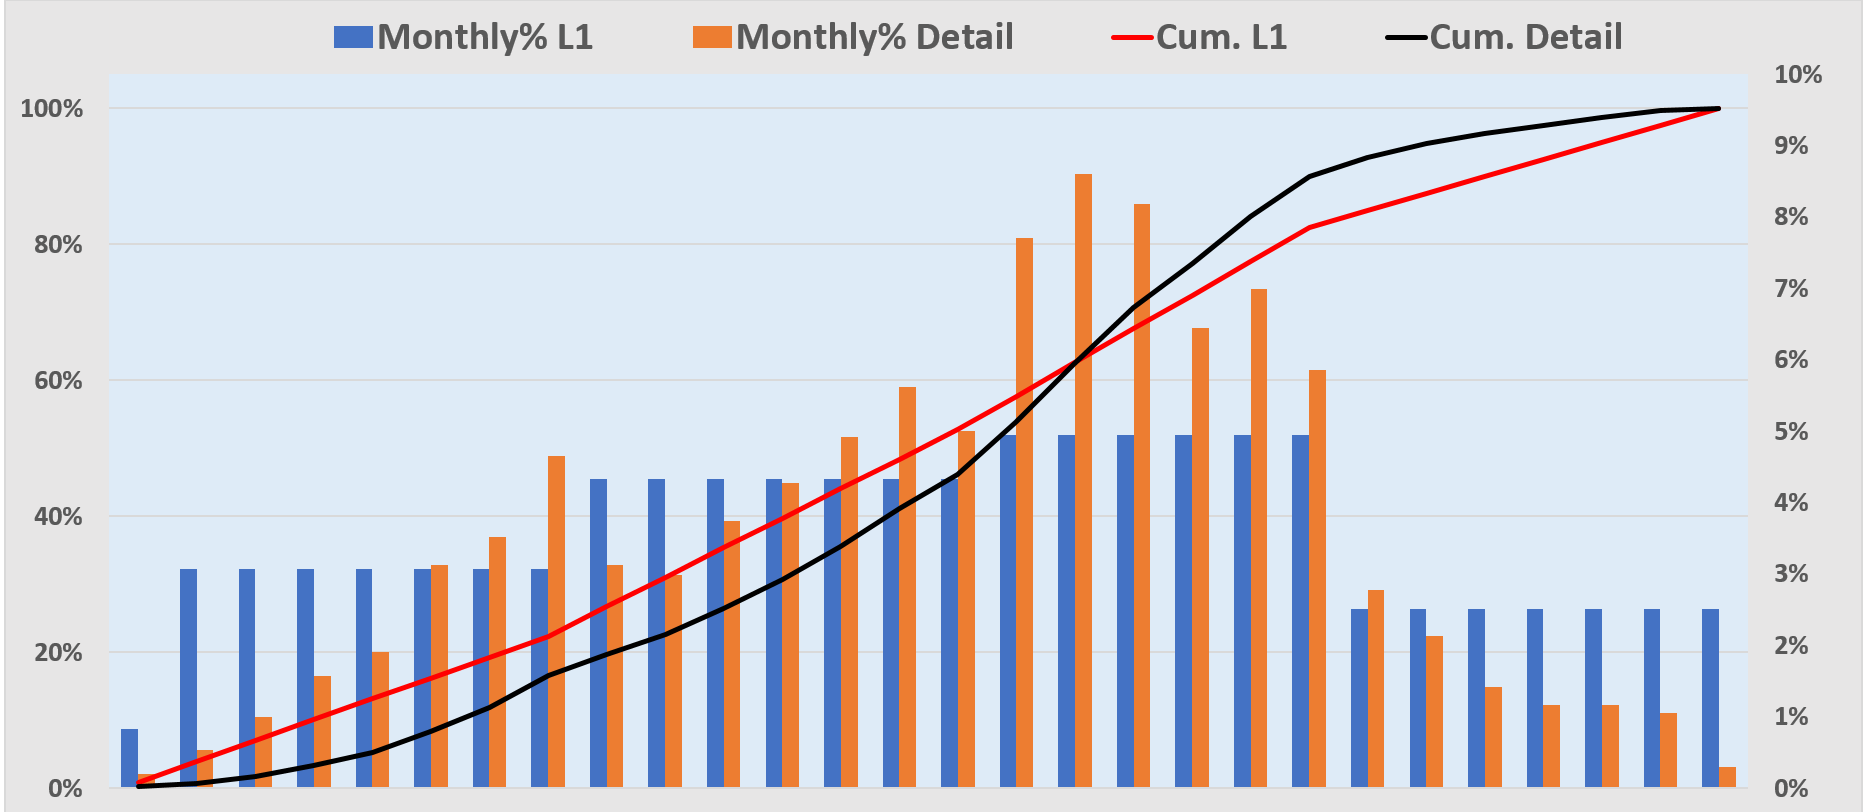
Red Curve/Blue Bars: Budget Distribution (E, P, C) | Black Curve/Orange Bars: Detailed Resource-Loaded Schedule
Which one represents the project plan progress more accurately? Obviously the second one.
Decision Risk
Can a PM make accurate decisions based on high-level S-Curves? Most likely not.
Success Rate
The chance of delivering a project successfully using high-level curves is dangerously low.
Why do projects rely on high-level curves?
Cost Engineers who cannot obtain a correct S-Curve from the planning team.
Planning teams unfamiliar with the mechanics of Resource Loading.
Consultants who fabricate curves to avoid embarrassment, only to blame the project later.
Discussion
No comments yet. Be the first to share an insight.
Leave a Comment