The Client's Dilemma
We were recently requested to assist a Client in reviewing their Project Schedule, Planning System, and Risk Analysis to verify the Completion Date of their recent Baseline.
Post-re-baseline, the actual curve sat comfortably between the Early and Late curves, suggesting a project on track. The contractor was insistent: the project would finish on time. However, our verification process told a different story.
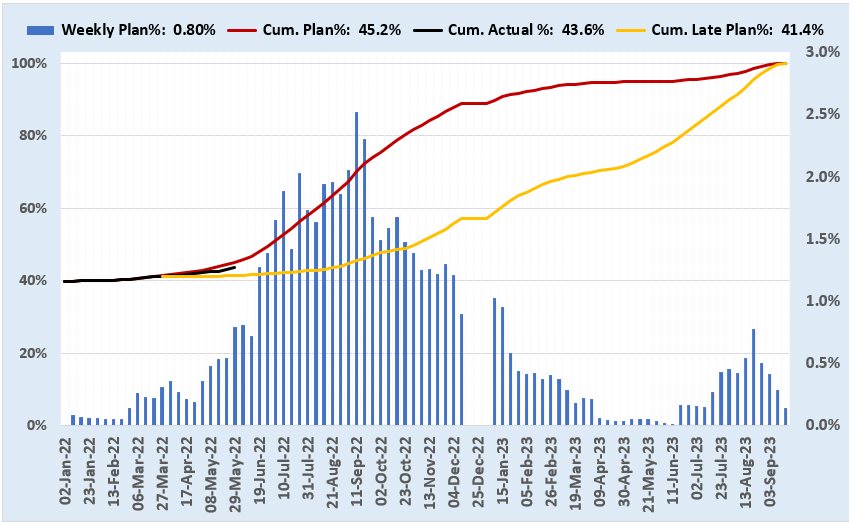
The misleading "healthy" S-Curve
Our Verification Approach
- Verified Plan Curve Data Source: The Planned Curves relied on DUMMY resources. We demonstrated how this misled the team by hiding low performance in the early stages.
- Verified Actual Progress Accuracy: We found that the tracking concept for weight values was misunderstood, leading to incorrect activity progress and faulty roll-up data.
- Trend Analysis: Assuming weekly progresses were correct, we utilized the Khono Analysis Toolkit (KAT) to determine the true Probabilistic completion date.
Toolkit Results: Probabilistic Completion
The analysis revealed a stark reality: The P80 date is actually 28 months later than the re-baseline finish date!
Key Dates Identified:
- P20 Date: 25-Nov-2025
- P60 Date: 13-Jan-2026
- P80 Date: 06-Feb-2026
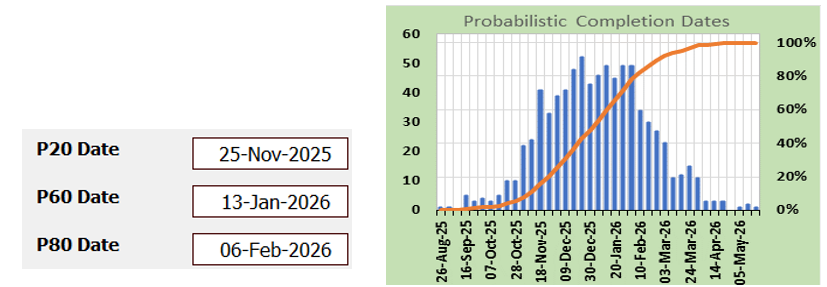
KAT Analysis Histogram & Cumulative Distribution
Forecast Comparisons
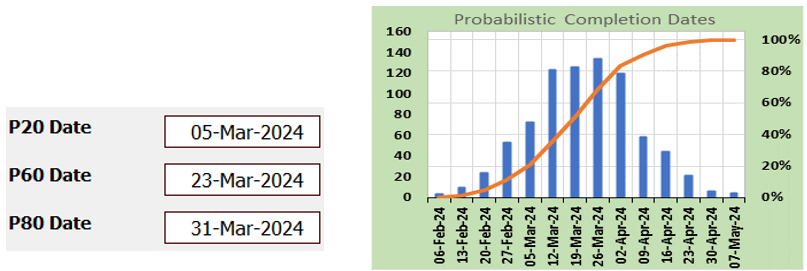
Contractor's Trend
The contractor claimed they could earn 0.64% per week. Even at this rate, the P80 date becomes 31-Mar-24—still 6 months late.
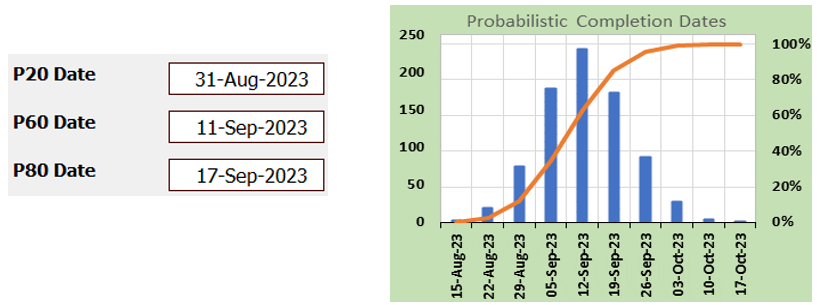
Required Performance
To meet the original deadline, our report confirmed the contractor must earn a minimum of 0.9% per week.
The Reality of Schedule Reliability
The forecast date of a schedule is directly dependent on the project performance (Schedule Reliability Factor). Without identifying and improving this factor, a project will simply not finish on time, regardless of what the re-baseline says.
Do you know your schedule reliability factor? Or do you trust your re-baseline blindly?
Discussion
No comments yet. Be the first to share an insight.
Leave a Comment