
16 Dec How to Forecast the Completion Date?
The forecast completion date is one of the common requirements from the PMs and Client for the PC team to calculate/demonstrate. Forecasting of the completion date is a very critical aspect specially to estimate the Time basis cost. There are many techniques/ solutions to be undertaken in order to satisfy the request. In this article we will review some of the them and the intent to introduce the upcoming Application which is under development.
1- Schedule
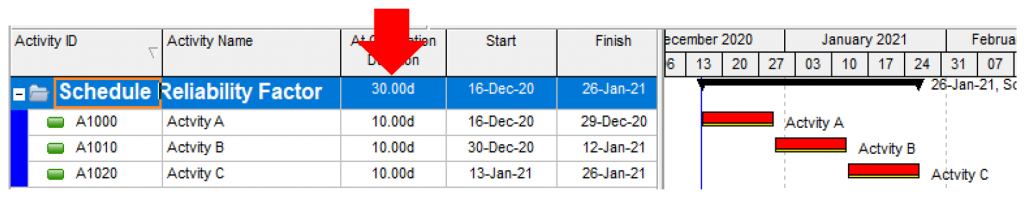
It is the most common source from which one could derive a relatively accurate date if the project is not behind Schedule. However, when the project is delayed, it will not produce an accurate and reliable date because it does not consider the effect of the schedule reliability factor. To illustrate the schedule reliability factor, consider the following example: In a project where there are 3 activities with 10 days durations and a FS relationship. The overall duration of that Project will be 30 days.
After 10 days, Activity A does not get completed and requires 5 more days to complete. As a result, the duration of the project moves out by 5 days and the overall duration becomes 35 days..
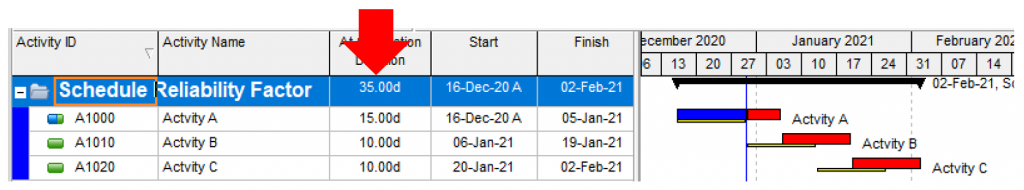
As per the logic and durations, the 35 days is an accurate calculation, but then the question becomes; How reliable or achievable is it to complete the project in 35 days? When the delay on the 1st activity is due to performance / productivity, it is most likely the trend will continue onto the next activities. As a result, the duration of Activity B and Activity C would be 15 days each and then the Project would finish 15 days late instead of 5 days. So, when the project is delayed due to lower productivity rate, the project completion date will be directly related to the productivity rate and the schedule forecasted date will not be reliable or its reliability would be equal to the performance, unless the productivity rate gets improved.
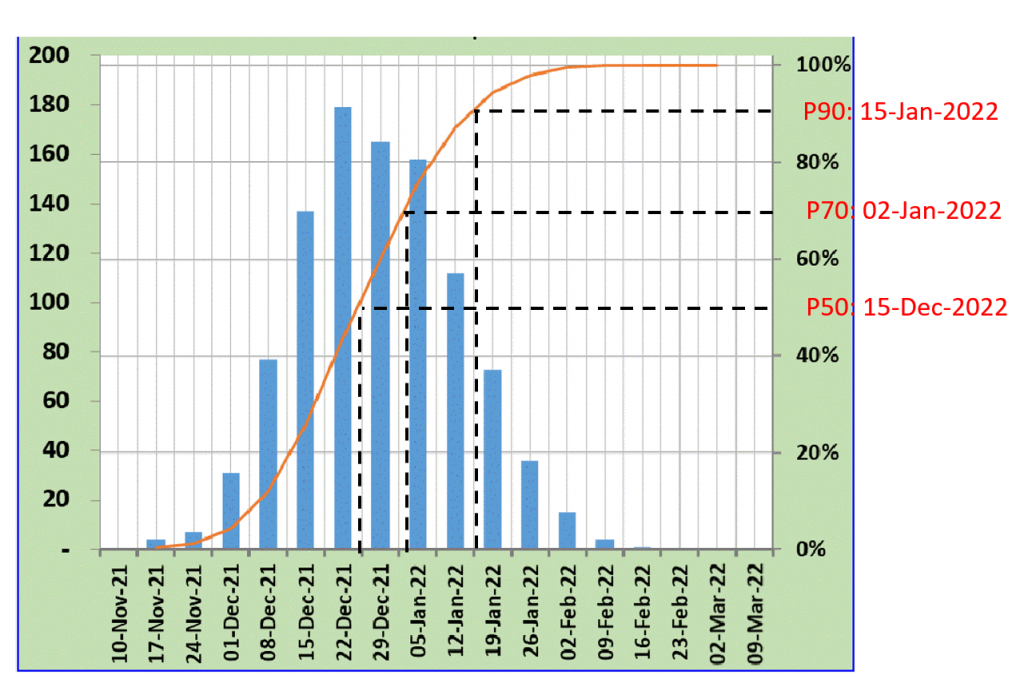
2- Schedule Risk Analysis
It is a more advanced forecasting tool/technique compared to the schedule hence it is frequently utilised by many mature companies for a better forecast date and forecast cost of the projects. It provides a probabilistic completion date (and cost) based on the loaded/assigned risk to the activities. Although, the accuracy of the output is much better than the schedule but some critics claim that it does not add much value as expected for various reasons. (the reasons are not subject of this article).
3- Performance Based Forecast
When the performance index (EVM indices) are available, they could be used to calculate the forecast dates. These forecasts are much more accurate than the schedule’s dates. However, they produce only one number/date after every update and also the performance indices do fluctuate. As a result, the project team might discredit and/or ignore it.
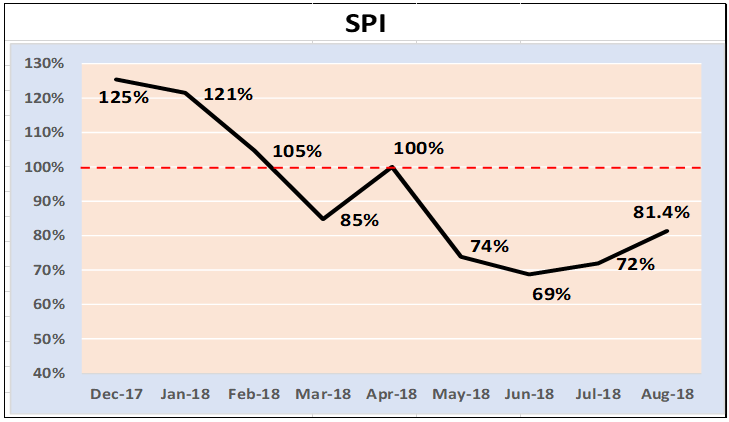
4- Trend Analysis
The trend analysis could be considered as a simple technique but it could provide a reasonably acceptable forecast date as per the continuation of the status quo. When it used, there will be, always, arguments about the range that was utilised for the trend, the project performance that will not continue with the same trend due to various reasons and etc. Also, the calculation is linear which most likely would not be true especially comparing it to the S-Curves.
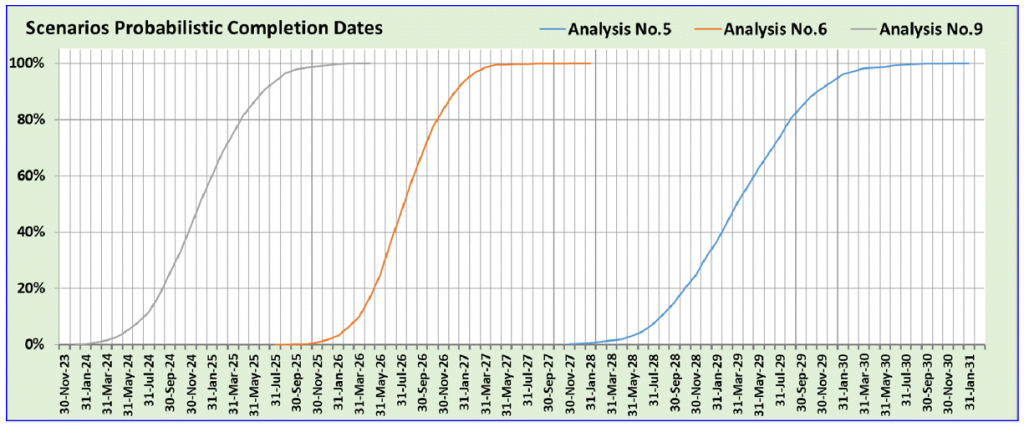
5- A method based on the combination of the above techniques
The technique provides probabilistic completion date, probabilistic progress curves. It would allow one to run several scenarios and then display all of them in a single chart. The outputs would assist the project team to have a better indication of the forecast date, evaluate the scenarios and make the most appropriate decision. Here are some screenshots from the developing version.

No Comments