
23 Oct S-Curve Accuracy: High Level vs. Detail
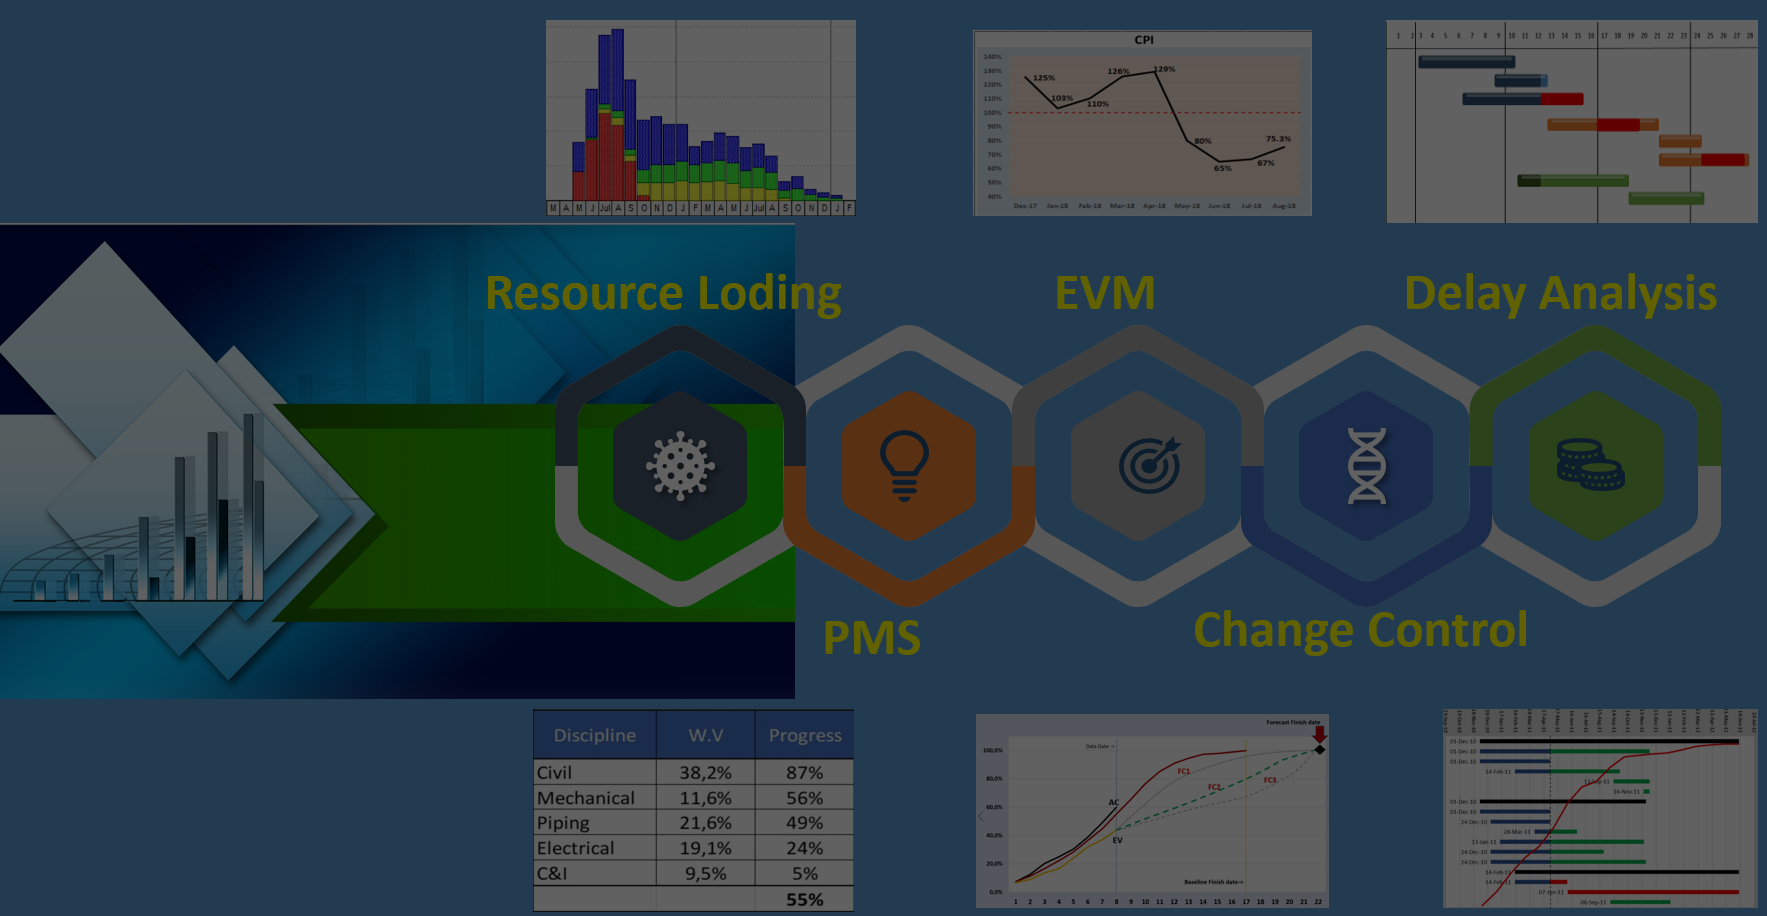
The image, illustrates two S-curves for a Project:
1- The Red curve and blue bars are developed based on the distribution of E, P, C budget
2- The black curve and orange bars are developed based on a detailed Schedule
Which one represents the project plan progress more accurately? Obviously the 2nd one!
What is the chance of delivering a Project successfully using the high level S-curve? Wouldn’t be high!
Could the PM make accurate decisions based on the high level S-Curve? Most-likely not!
The 1st curve, is most likely done by:
– Cost Engineer, who could not get the correct S-Curve from Planning team
– Incompetent planning team who do not know Resource Loading
– A consultant who does not know Resource Loading but to avoid embarrassment, fabricates such a curve. Then later on, blames the Project for not achieving the dates!?
Do you know how your Project’s S-Curve has been developed? How accurate is it?
Contact us to conduct a gap analysis then implement the Integrated Planning System.
Click Here to learn how to do resource loading and develop S-Curves

No Comments