
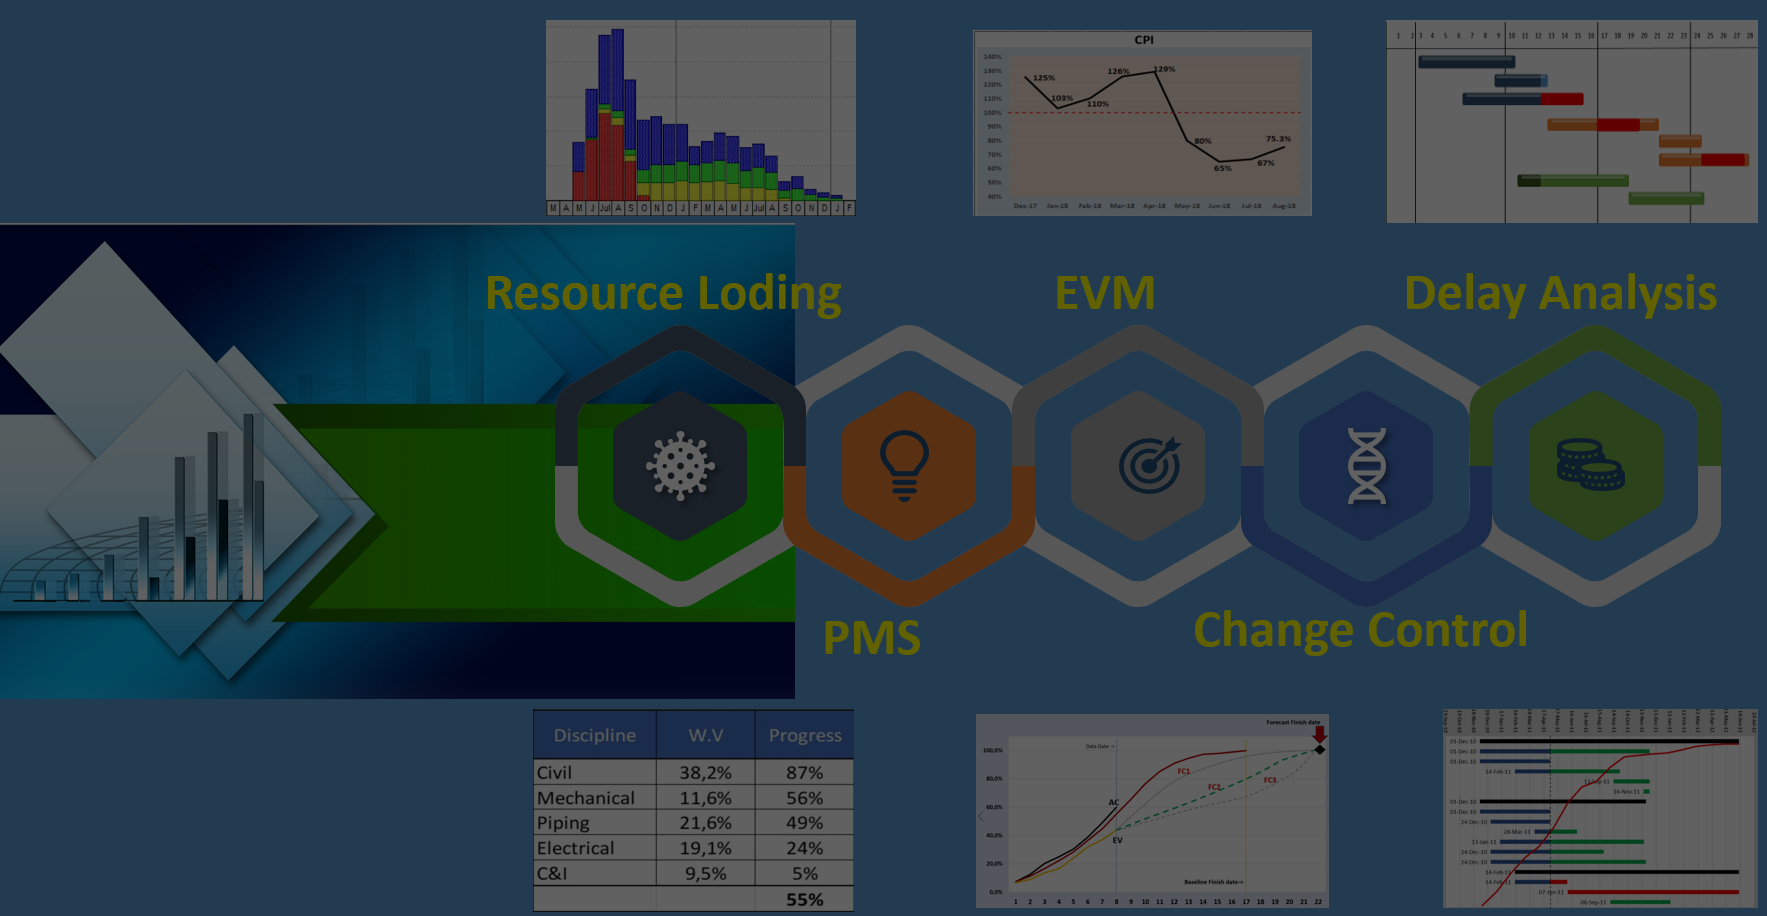
02 Dec Cost Value, Weight Value and Activities
Preparation of progress reports and schedule update is one of the routine works of the project planners. The accuracy of the reports and updates could be the tipping point for success or failure of the project. Due to same reason, most of the planners have a good knowledge of the types of progress measurement and weight values (W.V). However, there is always a thin fine line without which the system is bound to fail.
1- There is a set of weight values for EPC (kind of benchmark) which gets used by planners and project’s team. According to this set the Engineering W.V is 10%, Procurement is 40% and construction is 50%. Then, the planner gets instructed to use them in calculating the progress in conjunction with the Cost report (might be called BOQ Cost as well). For example, there is a line item in the cost report of a Feed water pump for $70k, then the planner develops an Excel file similar to the table below:
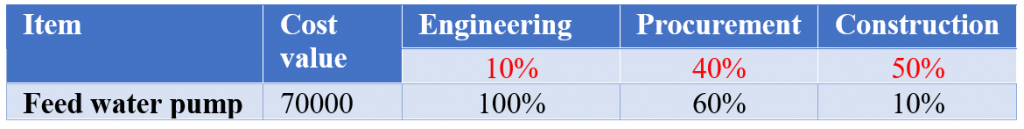
But, he realises that that there are 3 feed water pumps, 2 steam pumps and 1 electrical. Also, he gets told that the cost covers the foundation (E, P, C).
Then, the schedule it is developed as per the following:
E1000 – Develop Feed water mechanical drawing
E1010 – Develop Feed Water Civil drawing
P1000 – Procure Steam Feed water pumps
P1010 – Procure Electrical Feed water pumps
C1000 – Construction of Foundations C1010 – Installation of the Pumps
Note: the schedule could have more activities and be more complicated.
2- So, how the planner has to distribute the $70k amongst the activities, in order for the weight value if the activities and roll up to the progresses at the higher level?
3- The planner then distributes the cost to E, P, C using the weight value as per the table below:
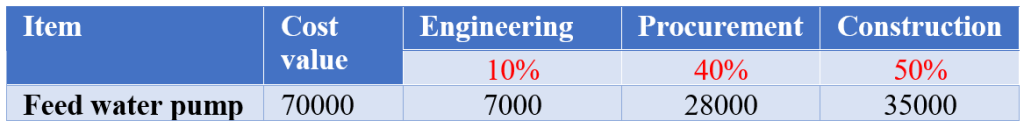
Then splits the cost of E, P, C equally among the activities despite the difference in the sizes and values. As a result, the weight values will be equal!
4- For the Resource/Cost loading the split costs get assigned to the activities. Then, the Planned S-Curve gets created!
5- Updating the progress of the activities, becomes thumb sucking a number as progress and remaining duration
So, the planner transformed one number ($70k) to many shapes and numbers like a magician! What is the basis for these transformations? Could any project rely on these numbers and become successful? The Resource loading and PMS implementation requires a lot of data, interfaces with client/contractor, contract, scope of work, purpose of the PMS, support, etc. which the Planner will not be able to handle (or even will not have authority on) for all of the data. The Planner must be able to consolidate all the data and set up the system correctly.
To implement the Integrated Planning System and learn the Resource Loading and PMS development, contact us.
No Comments