
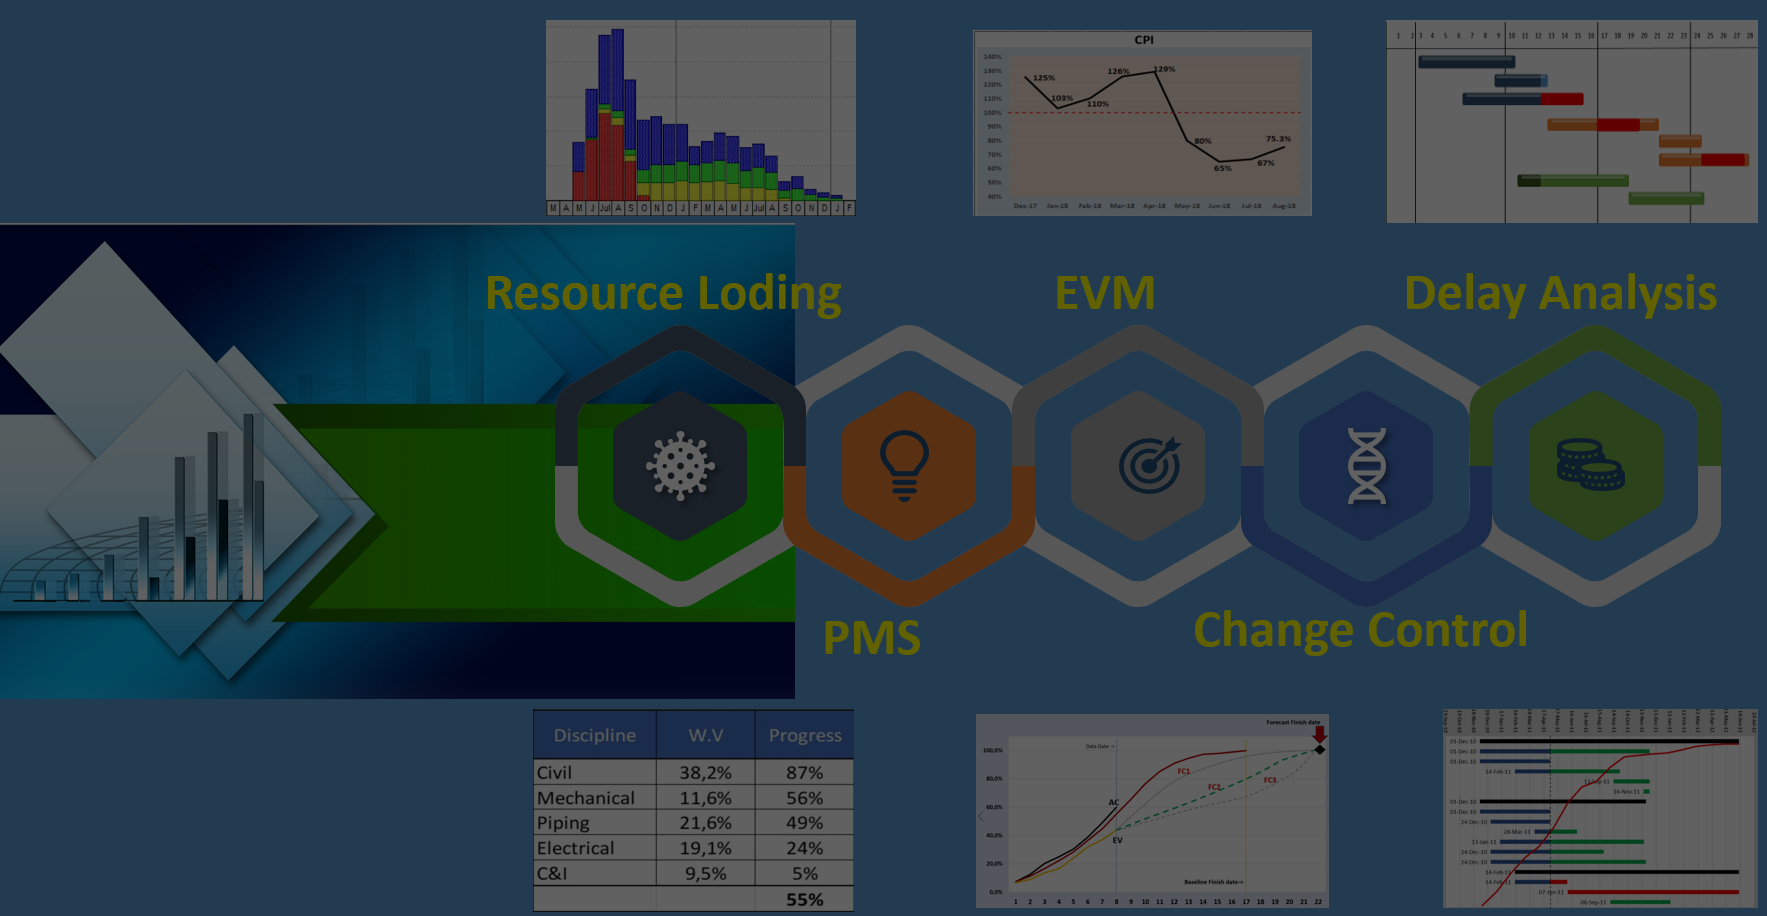
12 Jun Finish Date analysis Based on No. of Resources, Production Rate, Working Days
Have you ever faced a situation where a Project Manager requested you to calculate the required number of Resources for a specific discipline, but there was no detailed Schedule or the Schedule was not resource loaded? On occasions of this nature, linear calculations are often used, assuming a fixed number of resources and a consistent production rate throughout the Project. On the contrary, that approach is far from reality due to several factors::
- Mobilization of resources occurs non-linearly, meaning they may join the Project at different times.
- Production rates can be affected by weather conditions, leading to variations.
- Workable days per week or month may change due to weather conditions
- Holidays can impact the weekly or monthly production volume and as a result the finish date!
So, what is the solution?
It’s important to note that most Scheduling Software Packages either cannot incorporate these factors or require extensive calculations and manual data entry! IUnder circumstances of this nature , we utilise our Khono Analysis Toolkit (KAT). Let’s take a piping Project as an example to demonstrate the KAT process.
- Created a project with following information:

- Created a Calendar and assigned construction holidays

- Created three scenarios based on the following Piping information:

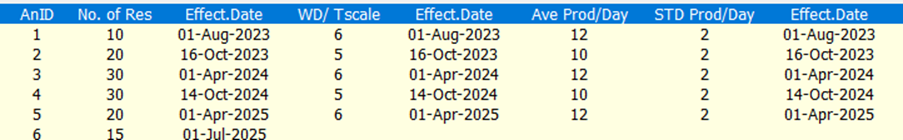
1- Starting with 10 welders, working 6 days per week and 12ID for production rate/day, then mobilizing 20 welders, working 5 days per week and 10ID as production rate. The details as follows:
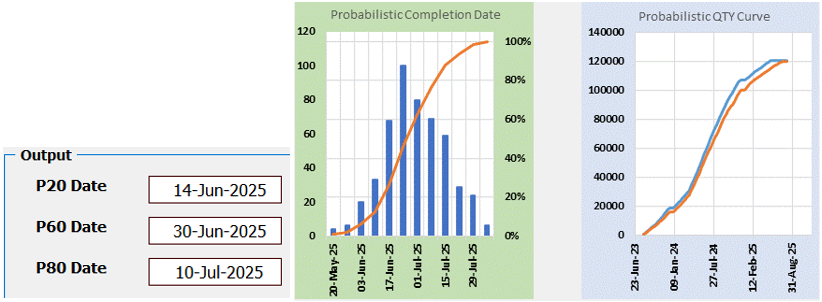
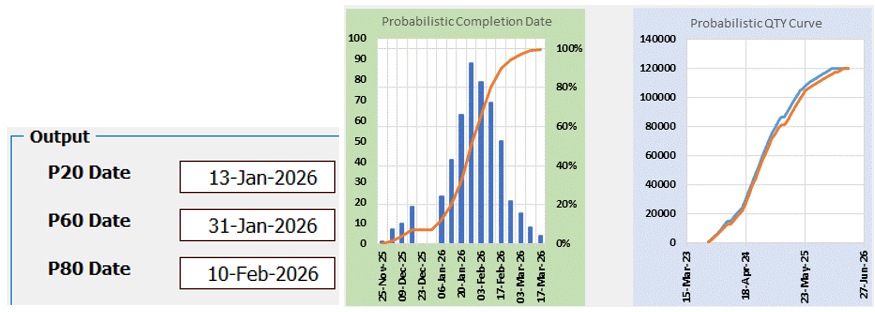
After running the KAT analysis, we obtain results in the form of charts:
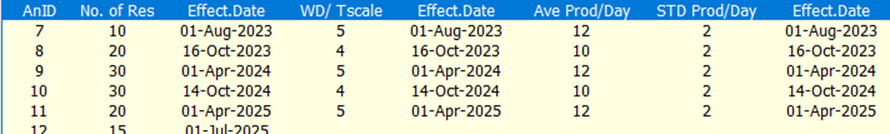
2- For the second scenario, it was decided to work 5 and 4 days per week, with the resource mobilization plan. The detail data is as follows:
The outcome of the analysis for the second scenario is displayed below:
3- For the third scenario, it was contemplated that the project could mobilise a more skilled welders who can weld 14ID per day. The data for this scenario is displayed below:

The analysis result is as follows:

Combining the results of these three scenarios, we can visualize the overall project progress:

- After discussing the outcomes and generating additional scenarios, we decide to proceed with the third scenario. We can then estimate the cost of piping based on this scenario.
One of the great features of KAT is the ability to export the analysis outcomes to Excel and generate more informative charts, like the one displayed below:

To learn more about KAT and its capabilities, check out the description in the following link: https://khonopc.com/product/khono-analysis-toolkit/
Feel free to reach out to us via email at info@khonopc.com for further inquiries.
No Comments