
19 May Project’s Duration and Time Contingency
Q: How much time contingency should be added to a Project’s duration?
Possible answers:
- One month for every one year?
- 2 months for every one year?
- 10% of the Project’s duration?
- 15% of the Project’s duration?
- Based on the Risk Analysis output?
- Nothing is allowed and contractor MUST complete on time!?
- Etc.
Estimation, calculation of Time buffer, Time Contingency and Project duration are always challenging due many reasons such as:
- Lack of procedure regarding the concept
- Policy and politics around the Projects
- Different procedures
- Lack of understating some decision makers and/or project initiation team as regards the concept
- Lack of understanding of the project’s characteristics and environment
- Known and Unknown risks and how they will they affect the project
- Etc.
Time contingency is super critical for Clients who generally fund the projects through banks or other financial institutions. In a less mature organization, they do not consider it and assume that the contractor should deliver it as per the contract. Some organization use a standard percentage (10%, 15%) of the project execution duration. And more mature ones, try to use risk analysis as best as possible.
As per our experience, one of the most important factors that have to be considered is the project performance. Calculation based on the performance could be very simple but surprisingly much more accurate. The main challenge of this approach, though, is being over optimistic especially at the early days of the project which would not be easy to take a lower rate. However, the project team, specifically Project Controls, should develop scenarios and present what the potential output could be as per each performance level.
To present the concept better, we have considered 8 Projects with the original duration from 6 to 48 months. Then, calculated the Duration based on the performances from 90% to 40%. The chart below illustrates the results:
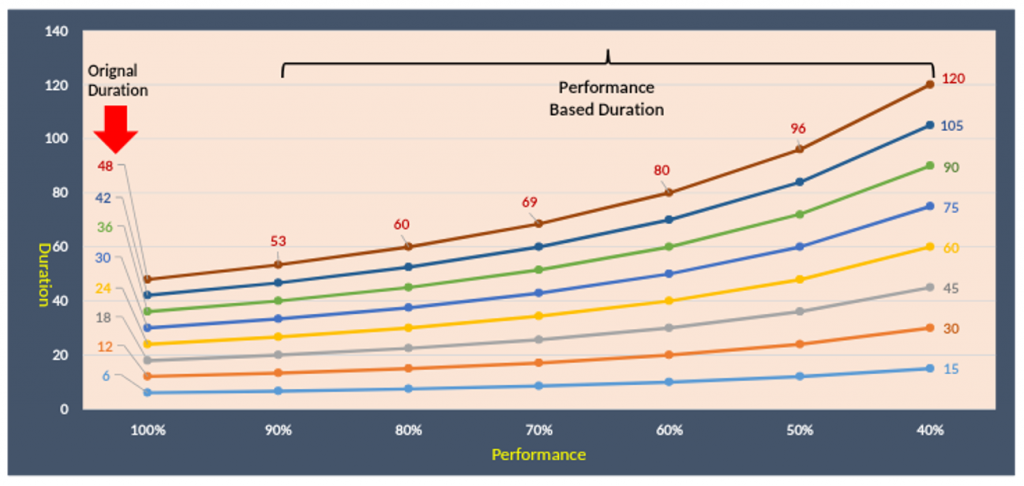
As per the chart, for a project with the Original Duration of 12 months, if it gets executed with 80% performance it could take 18 months to complete, 24 months with 50% and 30 months with 40%!
Or for a project with the Original Duration of 48 months, it could take 60 months with 80% performance, 96 months with 50% performance and 120 months and with 40% performance! The following chart illustrates the extended duration based on the performance.
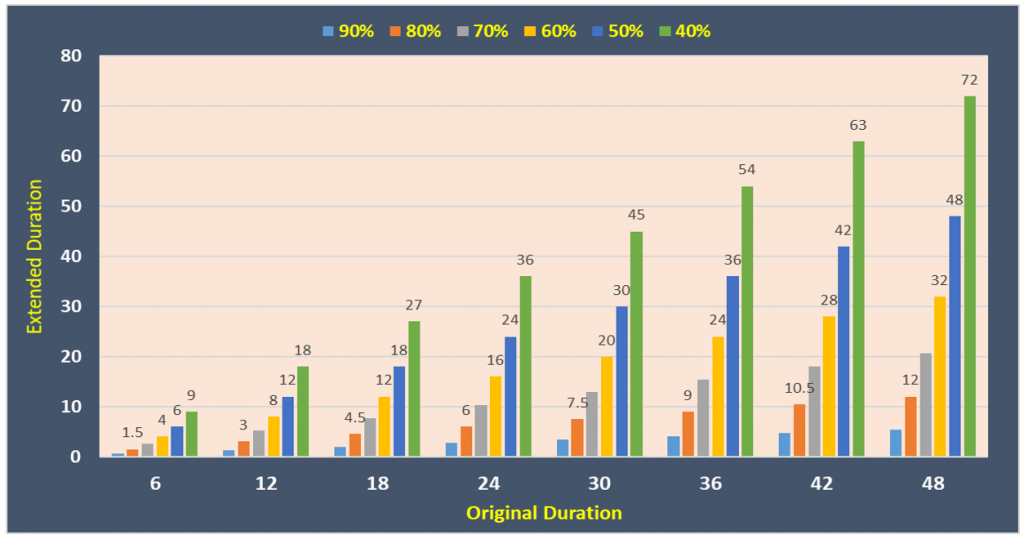
As per the chart, for a project with 48 months’ duration, the duration could be extended by 72 months with 40% performance!
Case studies:
- Kusile Power Station Project:
The construction works were started in August 2008 and commercial operation of the 1st unit was planned for June 2013 (about 59 months). However, the commercial operation of the 1st unit was achieved on March-2017 or took about 104 months. It means, the performance of the overall project was 57%.
The last of the power station was planned to reach to the commercial operation on Dec-2017 which was not met. Now, if we consider that the project would continue with the same performance until completion, the commercial operation of the last unit could be January 2025!
- Medupi Power station project:
The construction commenced in May 2007 and planned date for 1st unit (unit 6) to get to commercial operation was Jun2012 and last unit planned for December 2015. The actual date of the 1st commercial operation was on August 2015. It means the performance of the overall project was 62%.
So, forecasted date for last unit commercial operation based on the 62% performance, should have been March 2021.
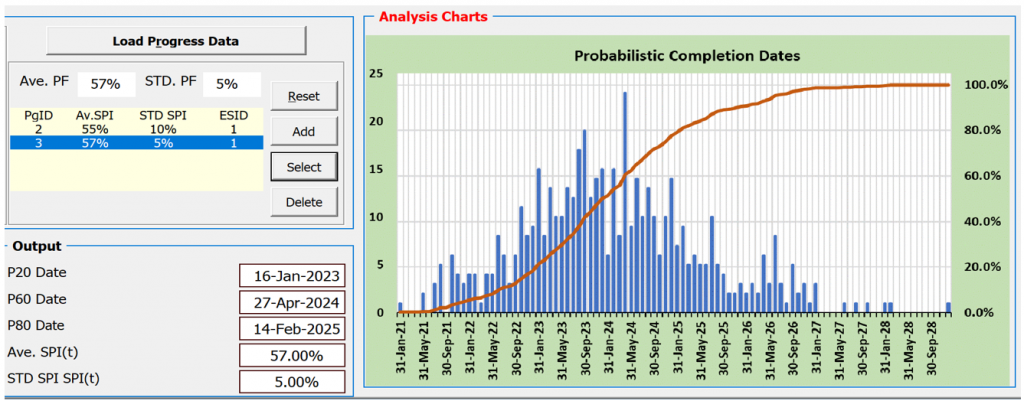
Utilizing the Khono Analysis Toolkit (KAT) for analysis
The above calculations are linear and considers that the performance stays at the same rate. Obviously, the performance does fluctuate therefore, to improve the forecast date, KAT Earned Schedule Analysis function could be used. KAT provides, three probabilistic dates for the last commercial operation
1- Kusile Power Station project:
Three probabilistic dates are follows:
P20: 16-Jan 2023
P60: 27-Apr-2024
P80: 14-Feb-2024
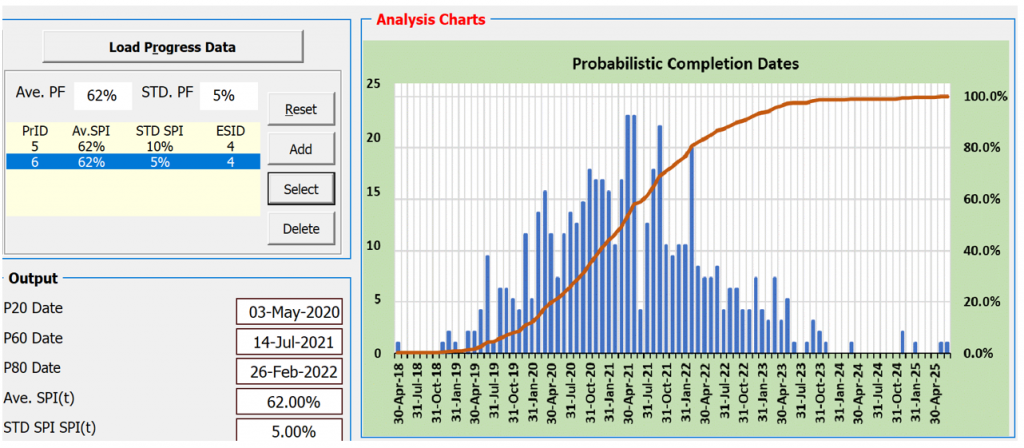
2- Medupi Power Station project:
Three probabilistic dates are follows:
P20: 03-May-2020
P60: 14-Jul-2021
P80: 26-Feb-2022
So:
- To forecast the next project duration and time contingency, what performance factor should be used? May be between 60% and 70%
- What could be the relationship between time contingency and cost contingency? Obviously the cost estimate could not be accurate without forecasting the project duration including the time contingency!
Do you want any assistance in analyzing your project forecast completion or if you would like to know how to apply this concept in your future projects then contact us now: info@khonopc.com
More detail about KAT here: https://khonopc.com/services/kat/
Source:

No Comments