
09 Jun Reality of Project management and Control!
When we look at the LinkedIn posts, we see many post about sophisticated concepts and techniques which seems majority of the projects around the world are utilizing these concepts and as the result they get delivered successfully!
However, our experience demonstrates the opposite scenario where the vast majority of the Projects are stuck in basics and failure owing to the lack of effective implementation despite many using CONSULTANTS! We have had many posts as regards utilization of Duration% complete, Dummy Resource, etc. to illustrates that Projects are failing in the BASIC concepts. Here are 3 cases we witnessed in the last 2 weeks:
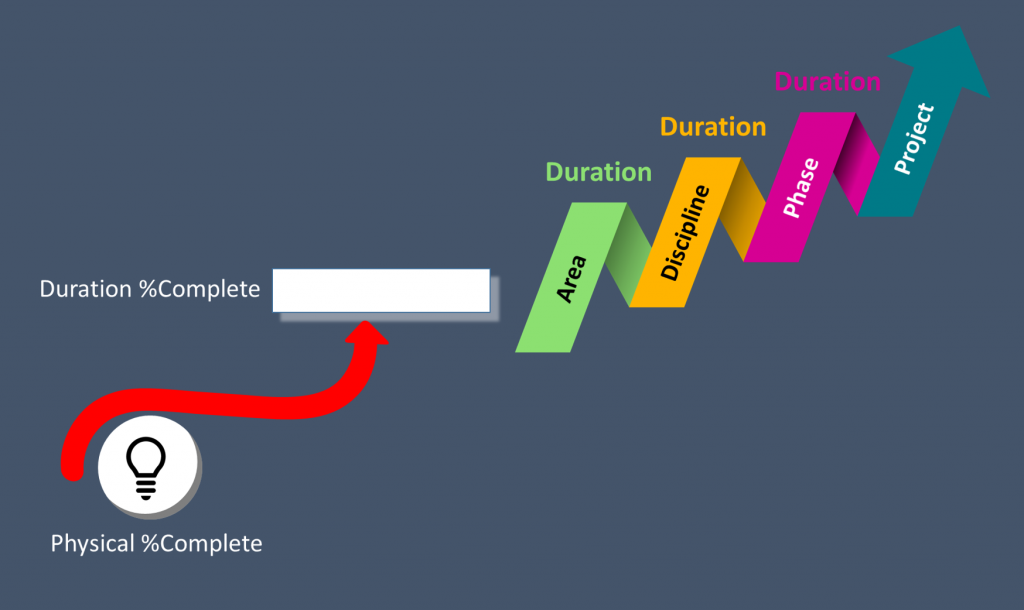
1- The contractor (who has a consultant on board) submits the Schedule and S-Curve indicating that they will not be able to undertake the Resource Loading, therefore, the S-Curve has been developed using a DUMMY resource and progress will be reported based on the Duration. As per the Progress report, the rolled up progress (based on Duration) was 72%. However, after some investigations and calculations, we found that the progress should be around 56%.
What does this practice mean? It means that the Planner was capturing the Physical %Complete in Duration %Complete field then was rolling the progresses up based on the activities Duration (what a mixture!). The rolled up progress was put next to the Planned Curve (which is the Cumulative Duration) and was reporting to the client that the Project was only 3% behind!!
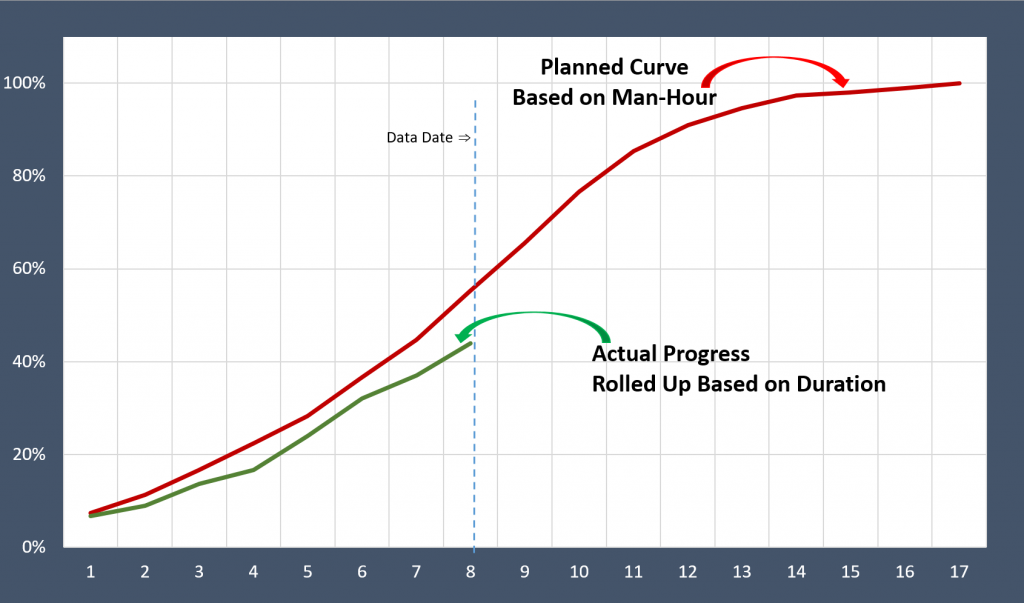
2- The Contractor had loaded man-hours into the Schedule and we assumed that it was correctly done The S-Curve of the project was done based on the assigned man-hours. However, in the schedule, Instead of Physical% Complete, Duration% complete was utilized. In this project, the progresses were: PL% = 45%, Actual% = 39% (6% behind the planned curve). After our investigation, we reported that the Actual progress should be about 25% (based on the P6 Earned Budgeted Units) which is 20% behind the planned curve!
What does this practice mean? In this practice, the Planned curve is based on man-hours and the rolled up progress is based on duration. So, the contractor was reporting the man-hours against duration which is without any hesitation absolutely wrong!
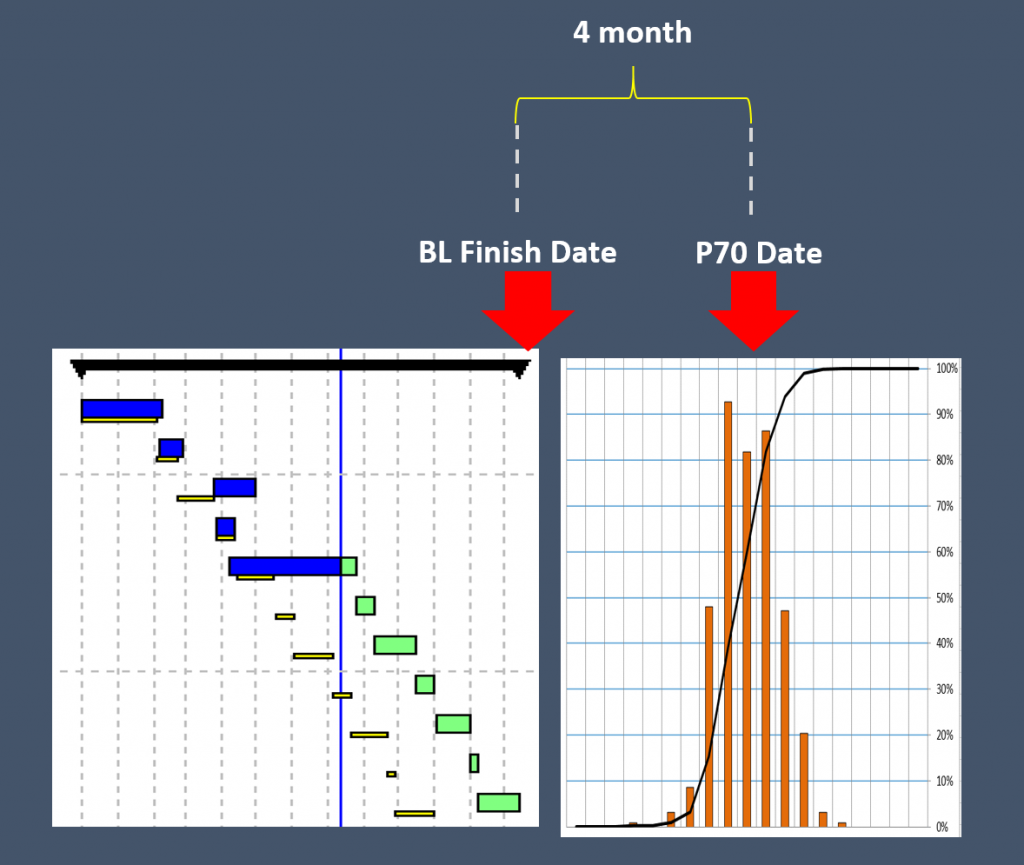
3- The third one was Risk Analysis where we had a similar one before (this one was a request from one of our trainees). The client requested a consultant to perform the Schedule Risk Analysis. The output of the analysis for a 28 months’ project was showing that the P70 date to would be about 4 months later than BL Completion date. Although some of the client team members were happy with the result but when we asked the question that if this is the case and you are certain based on the current risks there would be only 4 month delay, why don’t you report to senior management that the project would be 32 months and ask for a 32-month budget?
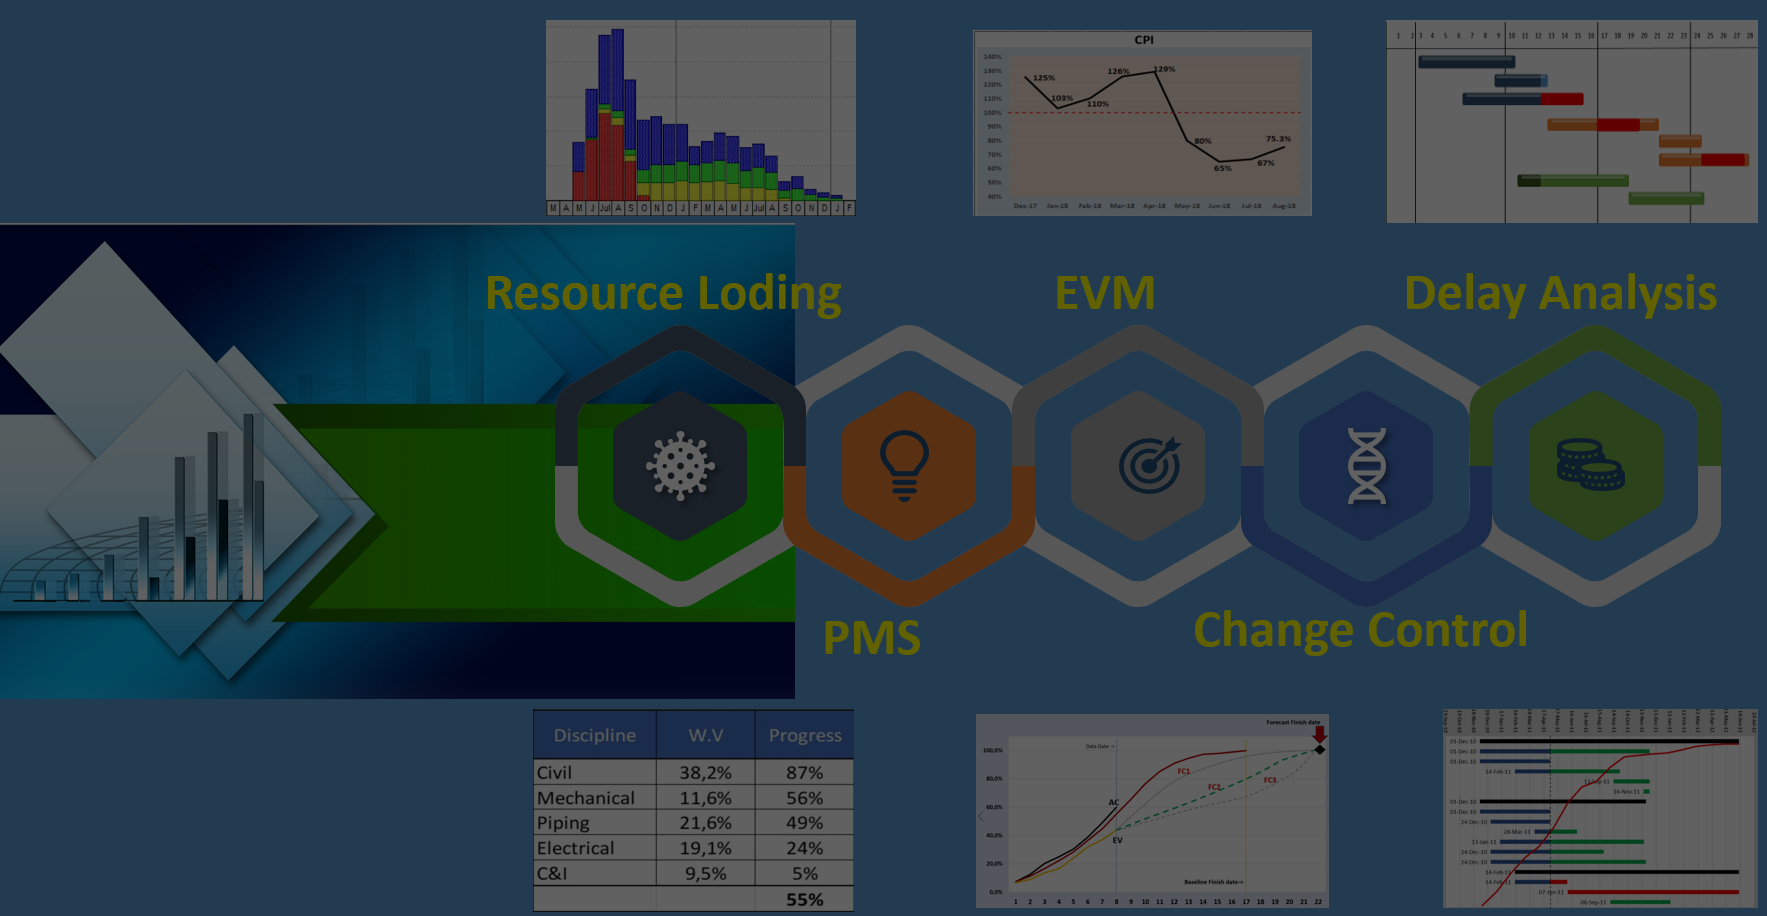
Progress reports, S-Curve, resource loading, analysis are simple and basic concepts that MUST be implemented and set up correctly. However, many projects (despite all the noises about the sophisticated concepts) get them wrong. So, don’t get surprised that the failure rates are still high worldwide!
How about your project and your Planning System? How certain are you that you have a correct system or you don’t care! If you care, then contact us before the total collapse!info@khonopc.com
No Comments