22 May The Importance of Accurate Data Sources for S-Curves in Project Management
Introduction:
An S-Curve is a well-known concept utilized in Project Management, to track and visualize the Project’s progress. However, developing accurate S-Curves can be a challenge to many Planners. In this short article, we will explore various processes for developing S-Curves and highlight the impact of incorrect S-Curves on Projects. Additionally, we will emphasize the significance of using resource/cost-loaded Schedules as the primary data source for generating reliable S-Curves.
Processes for Developing S-Curves:
1- Extract data from resource /cost loaded Schedule and develop the Charts in Excel spreadsheets.
2- Using activity durations as a representation of work: In this approach, activity durations are treated as work units, and a dummy resource is assigned to each activity. This data is then used to create S-Curves in Excel.
3- Assigning 100 budgeted units to each activity: This method assigns a fixed value of 100 units to represent the progress of activities. S-Curves are generated in Excel!
4- Linear distribution of Project costs: This process involves distributing Project costs linearly from the start to the finish of the Project, which is then used to construct S-Curves
5- Manipulating data in Excel to achieve an S-shaped curve.
6- Using software without understanding the underlying calculations: Certain software tools generate S-Curves automatically without providing insight into the calculations
7- Using some softwares that generate the chart without knowing the bases of calculation
8- Updating progress data along the data date: This approach involves adjusting the data date from the start to the finish of the Project based on the updating interval, capturing the progress made!!
Impact of Incorrect S-Curves:
To illustrate the consequences of incorrect S-Curves, we have developed three examples for a real (existing) Project. These examples highlight the discrepancies between different S-Curve representations and their implications for Project analysis.
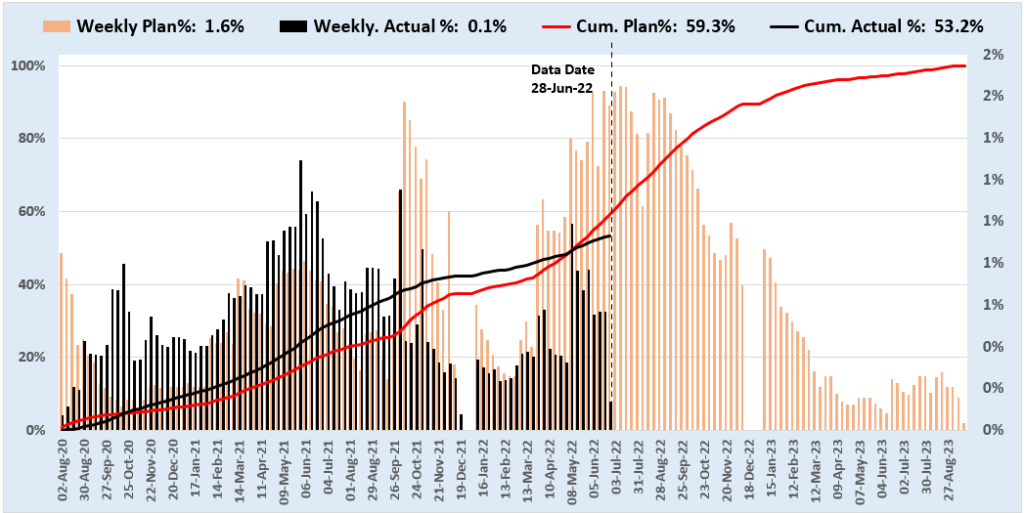
1- S-Curves based on a dummy resource: The chart below displays the planned and actual progress curves based on the assignment of a Dummy resource.

According to these S-Curves, the project initially maintained a lead over the schedule for an extended period. However, it eventually experienced a 6.1% slippage and fell behind schedule. It is important to note that the actual progress curve exhibits an upward trend, which could potentially create a false impression of improvement and give the Contractor a misguided belief that they will recover from the delay.
2- S-Curves based on 100 budgeted units: The developed S-Curves based on the assigning of 100 units to all activities, as follows:

Also in this scenario, the project was ahead of schedule at the start of project for many months. then the actual progress fell behind schedule by 13.5% . Apparently, some activities have shown progress in previous weeks according to the actual curve,
Comparing this chart to Dummy resource shows that the actual progress is 13% less than the dummy resource representation!
3- S-Curves based on resource loading and physical % complete: The S-Curves based on the resource loading is follows.

These S-Curves demonstrate that the project is 6.4% behind Schedule. The actual progress trend remains almost flat for several months, indicating no progress being earned. This accurately reflects the Project status, as it was focused on finalizing technology options.
Conclusion:
The selection of a reliable data source for generating S-Curves is crucial for successful project management (as minimum). While many project managers accept S-Curves that merely resemble an S-shape, the repercussions of using incorrect S-Curves become evident over time, leading to extended durations and budget overruns. To avoid these pitfalls, it is imperative to base S-Curves on resource/cost-loaded schedules. If your Project’s S-Curve does not rely on such Schedules, the consequences will inevitably arise. For assistance in implementing a planning system that includes resource loading and accurate S-Curves, please contact us at: info@khonopc.com
or If you want to learn the Resource Loading in depth, refer to this link: https://khonopc.com/services/training


No Comments