
29 Mar What is the S-Curve Data source?
An S-Curve is one of the well-known and most used reports on the Projects which becomes like a road map of Project execution. Despite the popularity, there are still Planners that do not know how to develop it and Project managers that have no idea on how to read/analyse it correctly but merely accept it as long as it has an S shape!
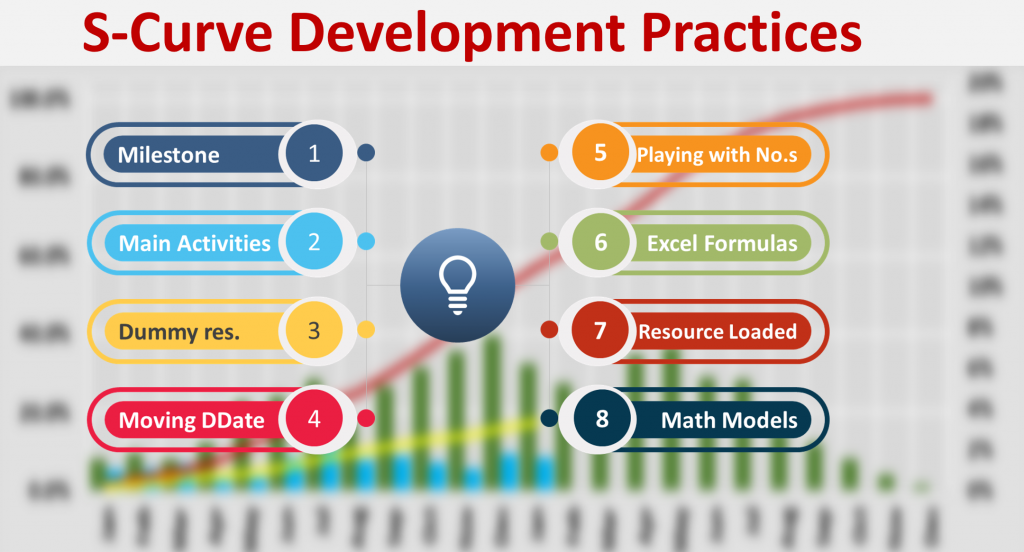
Here are some of the practices used to develop an S-Curve:
- Based on the project’s (package or phase) milestones.
- Based on the distribution of the cost / man-hours of the main activities list. The list could cover few or several hundred activities!
- Based on the Duration of activities in the schedule! Some planners prefer calling it Dummy resource. As per this practice, the longer the duration of an activity, the higher the value.
- The Planner moves the data date of the BL schedule from the project start to the end as per the reporting cycle then reads the calculated Planned progress by the software. In order to develop the S-curve for a 2 years’ project with weekly updating cycle, the planner moves the data date by more than 100 times!
- The planner plays with the percentages in Excel (without any justification) to get some kind of S shape!
- The planner uses some of the Excel or mathematical formulas (to make it legitimate and sophisticated!)
- Based on the resource/cost loaded schedule.
- Etc
Most of the above practices are incorrect and instead of assisting the project manager they tend to mislead and accelerate the failure of the projects. For example:
- No. 2 could be acceptable. However, generally this practice is done in Excel therefore developing a forecast curve (after every update) will not be an easy process. As a results, forecast curve gets ignored!
- The No.3 gets used due to lack of knowledge, competency and misunderstanding the entire concept by the planner. We believe if a planner develops an S-Curve based on the Dummy resource, he/she should be dismissed immediately from the project. The worse of all is that some consultants or experts that are selling this practice to the projects and companies!
- Or No. 4 that might take days or weeks to complete it! And most of the time the progresses are based on the Duration% complete!
- The No.5 and even No.6 are the worst ones that should be avoided at all costs!
So, what is the data source and correct practice of an S-Curve development?
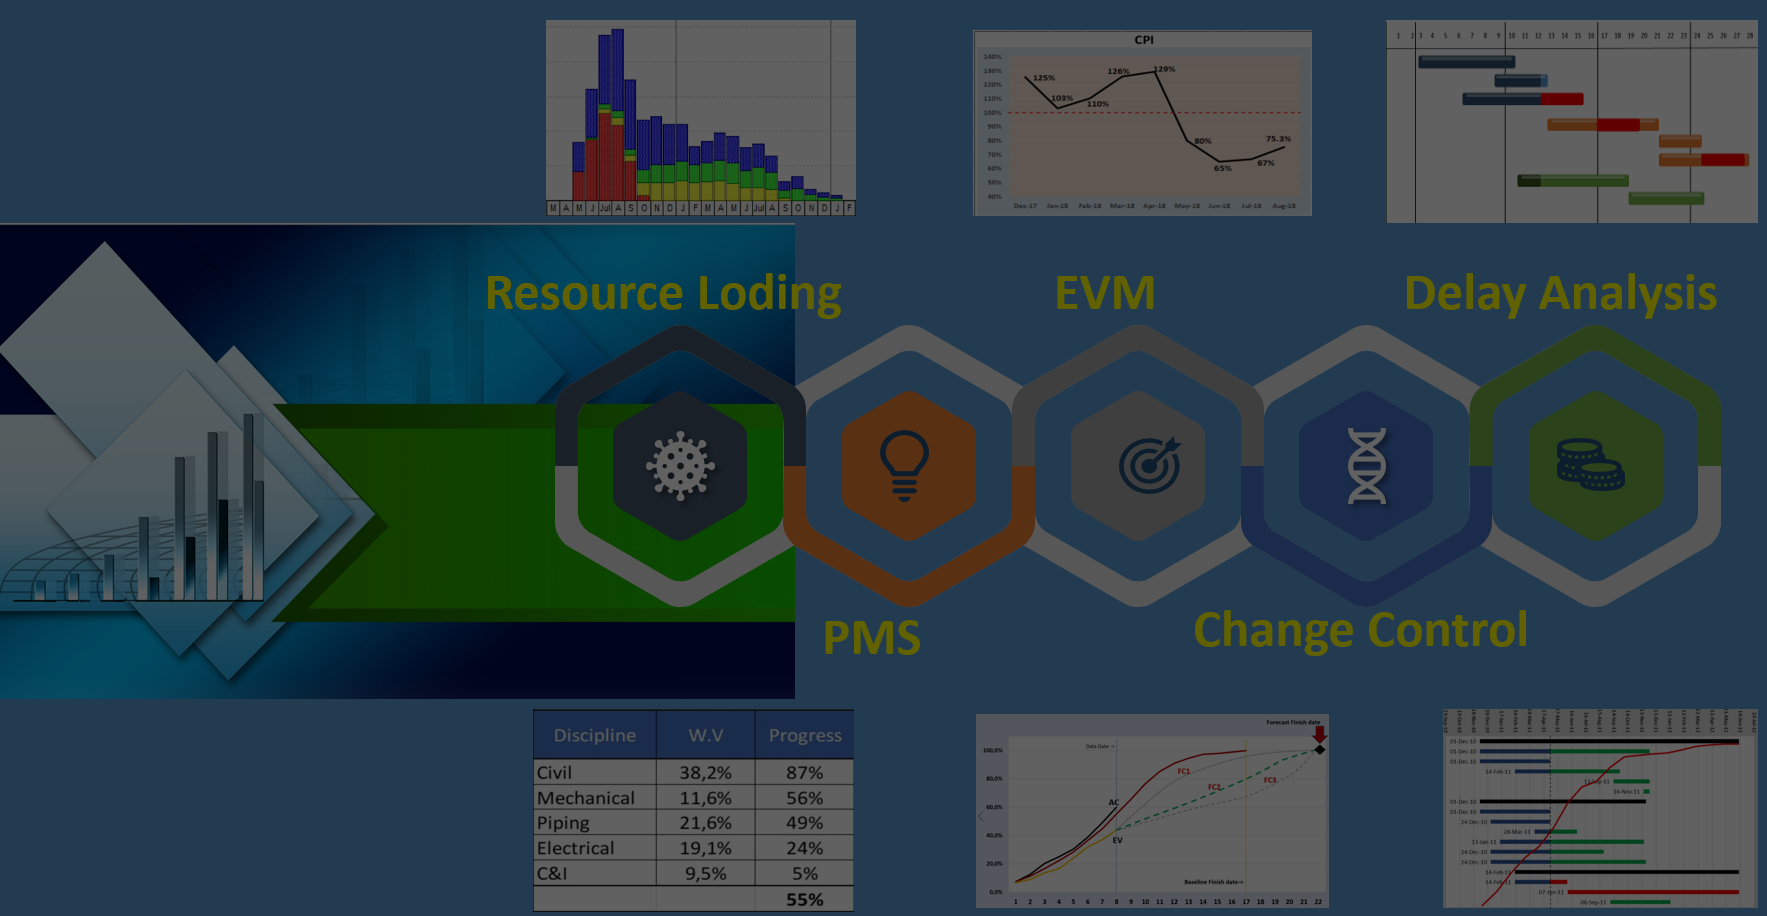
The data source for most of the capital projects is a Resource Loaded schedule. As we have experienced, many planners are still failing to undertake it correctly. It means, the S-Curves of many projects are invalid. Therefore, the questions that beg the answering are the following:
- How could a project be delivered on time, on budget with a WRONG road map/S-Curve?
- Why are the planners reluctant to learn resource loading a Schedule?
If you would like to learn resource loading for capital projects including Engineering and Construction, then contact us: info@khonopc.com
Satish Kumar
Posted at 18:01h, 01 AprilVery well said Elliott Sir, you are absolutely right many planner Playing such types of game whatever reason ie Company process or system or another one is lack of knowledge..